Archive | News RSS
‘Rocked’: NASA scientists brave bumpy flights into winter storms
A BIOS Treasure: The Tudor Hill Marine Atmospheric Observatory
by: Bermuda Institute of Ocean Sciences
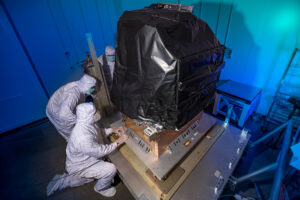
TEMPO Air Pollution Sensor Integrated with Satellite Host
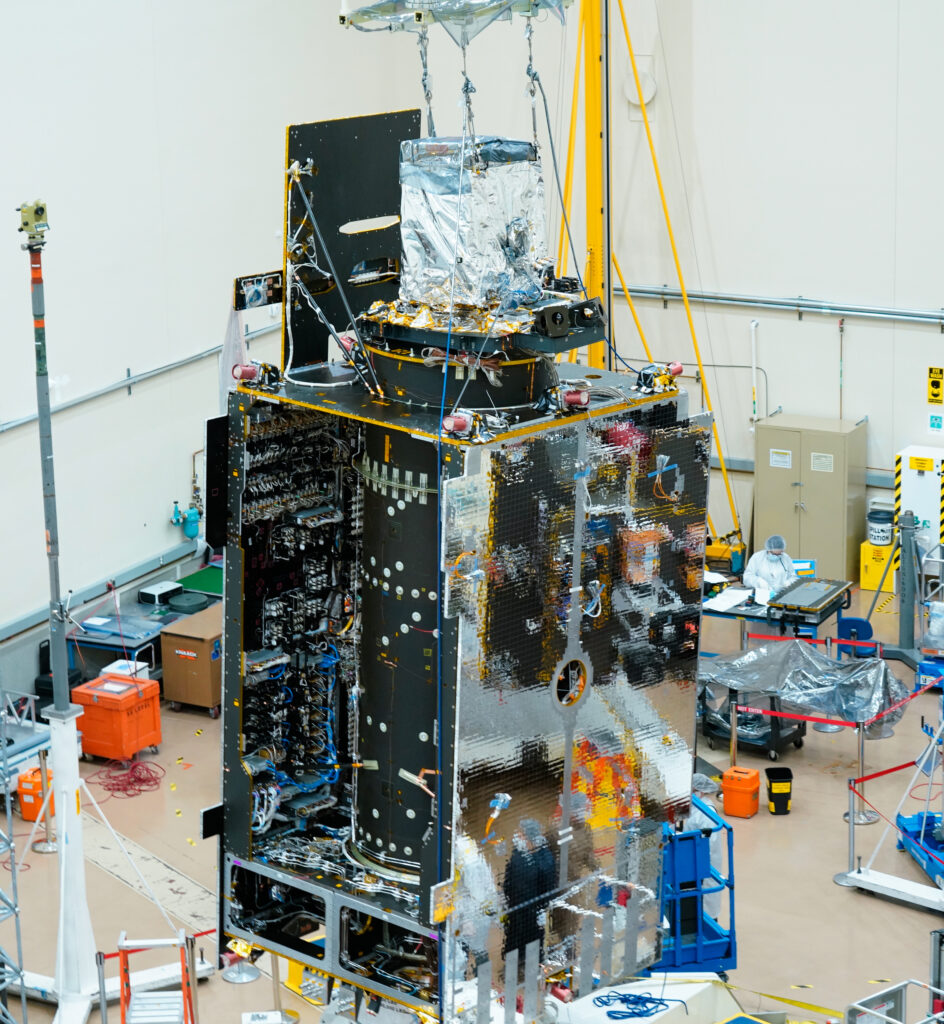
Credits: Image courtesy of Maxar
An air quality sensor that will dramatically improve the way scientists measure air pollution over North America has been joined with its satellite host.
NASA’s Tropospheric Emissions: Monitoring of Pollution (TEMPO) instrument was integrated with Intelsat 40e by Maxar’s Space Program Delivery team in Palo Alto, California. From its geostationary orbit — a high Earth orbit that allows satellites to match Earth’s rotation — TEMPO will take hourly daytime observations of air quality over an area that extends from Puerto Rico to northern Canada, from the Atlantic to the Pacific, encompassing the entire continental United States.
“Because of the hard work and dedication of the entire TEMPO team including our Maxar, Intelsat, and Ball Aerospace partners, we are excited to have completed this significant step toward launching with the IS40e spacecraft ” said Kevin Daugherty, TEMPO project manager at NASA’s Langley Research Center in Hampton, Virginia. “We are looking forward to completing the instrument integration and spacecraft testing in the coming months bringing us closer to delivery of TEMPO’s critical air quality science.”
Air pollution — including ozone, nitrogen dioxide and formaldehyde, and tiny atmospheric particles called aerosols — can have serious consequences for human health and the environment.
Currently scheduled to launch in 2022, TEMPO will also form part of an air quality satellite “virtual constellation” that will offer a more holistic view of how pollution is transported around the Northern Hemisphere. Ball Aerospace in Broomfield, Colorado built the TEMPO instrument.
Kelly Chance, of the Smithsonian Astrophysical Observatory in Cambridge, Massachusetts, is the principal investigator for TEMPO.
NASA Langley Research Center Last Updated: Dec 1, 2021 Editor: Joe Atkinson
https://www.nasa.gov/feature/langley/tempo-air-pollution-sensor-integrated-with-satellite-host
Preparing for Landing: NASA’s S-MODE Wraps up Last Week of Experiments
By Dragana Perkovic-Martin, Principal Investigator for DopplerScatt at NASA’s Jet Propulsion Laboratory // SOUTHERN CALIFORNIA //
11/02/21
Yesterday was a hard down day for the team – everyone needed a rest after a very active week before. The hard down days are in NASA airborne rules and ensure that fatigue does not set in and keep everyone’s safety the top priority.
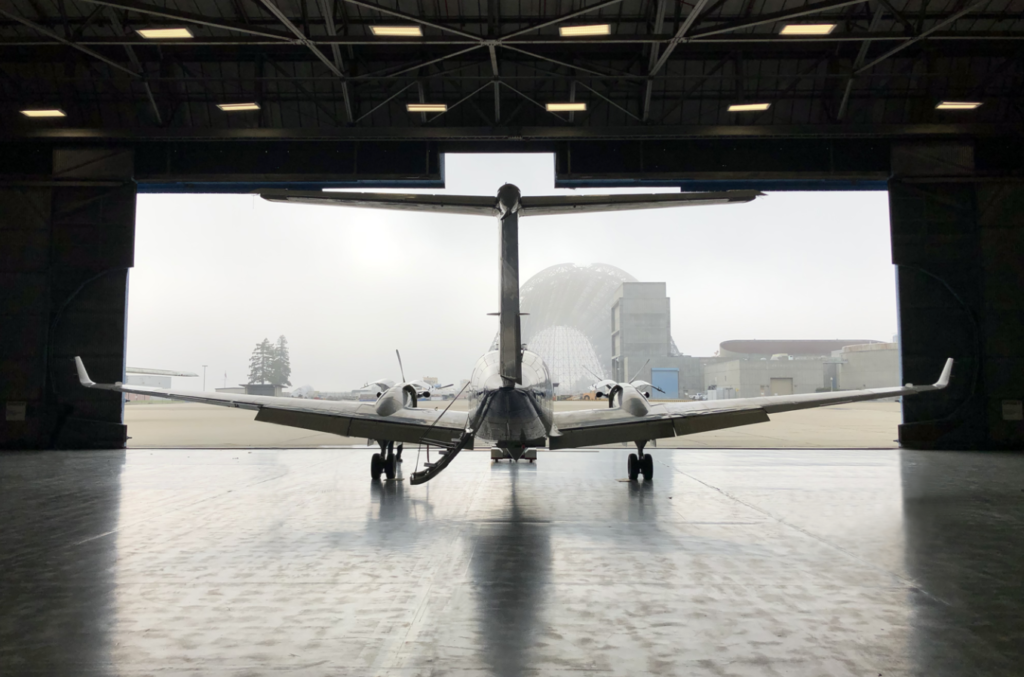
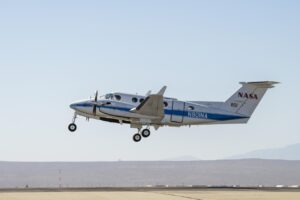
Spooky! NASA King Air B200 and the early morning fog at NASA Ames Research Center. Photo credit: Alex Wineteer / NASA JPL
To fly or not to fly … Today is supposed to be a good day for optical measurements but the pesky fog is really not willing to leave the area of S-MODE operations. We sit and wait for updates from the ship, satellite imagery and forecasts. In the meantime, we are using the Saildrone measurements of wind speed in the area of interest to determine if it’s worthwhile to operate DopplerScatt. The winds are very low. The hourly reports are telling us that the winds have been below DopplerScatt’s threshold for the whole morning, reporting wind speeds of one meter per second. At this wind speed the ocean surface is very still, so still that it may look like a mirror. This is bad news for radar signals bouncing off the surface as their strength depends on the surface roughness. No dice for DopplerScatt today, and the same decision was made for the MOSES and MASS instruments on the Twin Otter.
11/03/21
Remember that pesky problem with the monitor from last week? I overnighted a replacement monitor for the DopplerScatt team since yesterday was a doozy with no flights, they decided to swap out the monitor and keyboard on the plane. Trouble is they did not test that it worked. We just thought, “well what could go wrong, it’s the same model.” What do you know, it did go wrong! I’ll spare you the details and the frantic messaging between myself and the operators, but after some time they realized that the power cable was not plugged in and the monitor was not getting power. All in a day of DopplerScatt deployments!
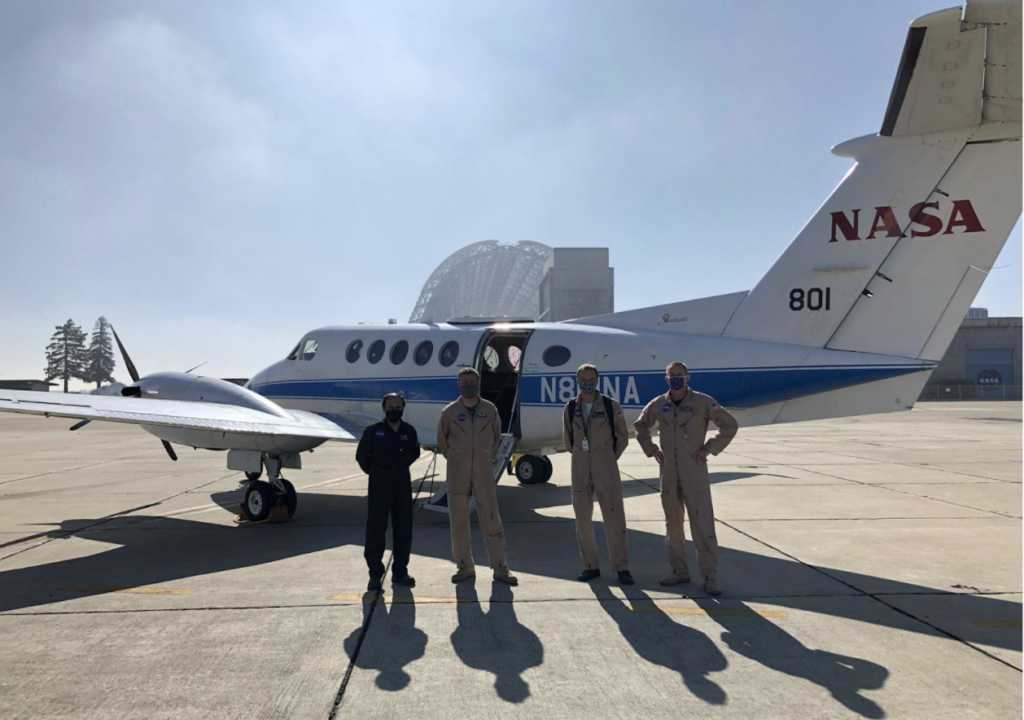
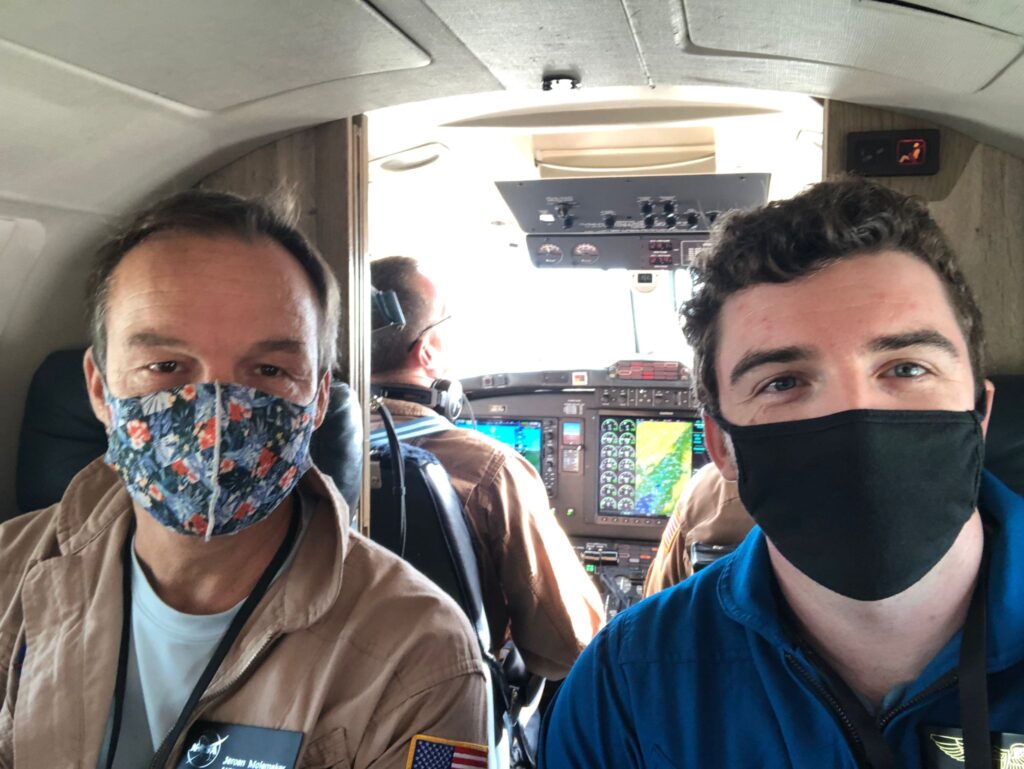
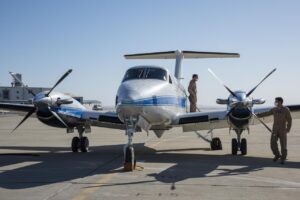
Crew of the day from left to right: Karthik Srinivasan (JPL DopplerScatt operator), Hernan Posada (AFRC pilot), Jeroen Molemaker (UCLA MOSES operator), James Less (AFRC pilot). Photo credit: Alex Wineteer / NASA JPL
11/04/21
Today is a science extravaganza! We have a big day ahead of us with two NASA King Air B200 flights planned and all of the in-water assets sampling data throughout the day. The weather is finally cooperating and we have a clear yet windy day ahead of us. The plan today is to fly a morning flight – which just took off at 8am – and then another one leaving approximately 6 hours later and flying the exact same pattern. The comparison of data between the two will tell us about the daily variability of the ocean processes.
“This is one of the reasons why I am so excited about S-MODE,” said Hector Torres, DopplerScatt team member, operator and one of the main people responsible for simulating ocean processes. “The results based on theory and numerical simulations produced in the last five years are about to get confirmed or debunked today. Either way it will be a breakthrough!”
Flight one is now done! There were some pesky low clouds right in the area of collection that prevented MOSES from collecting quality data for half of the flight, but the second half was great. DopplerScatt data collection went as planned and data are churning already! We are seeing the first quick look data products trickle in as we watch the afternoon flight take off.
While the first flight was a bit difficult for our optical colleague running the MOSES system, Jeroen Molemaker from the University of California, Los Angeles, the afternoon was gloriously clear and provided a great opportunity for all airborne instruments to collect data at the same time.
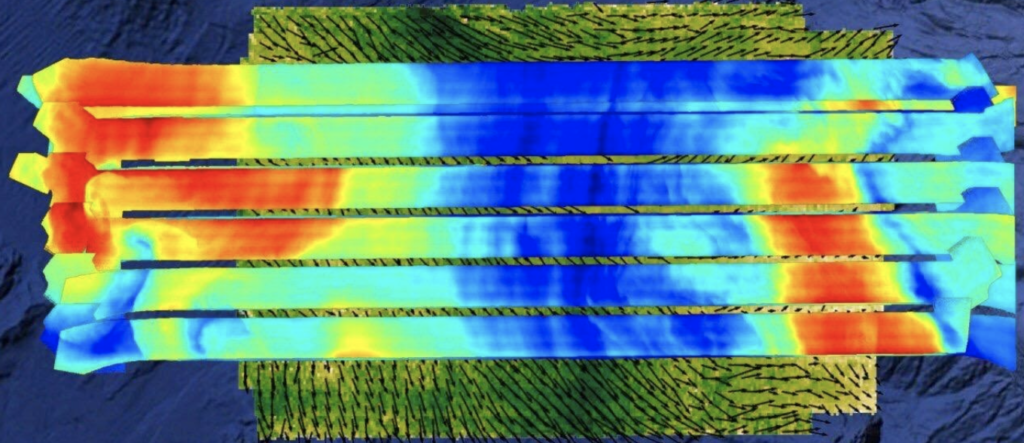
Quick look composite image of the sea surface temperature as observed by the MOSES instrument on the November 4, 2021 afternoon flight. The tracks are overlaid on DopplerScatt derived surface current velocities from the morning flight, showing the spatial relationship between currents and density fields. The color scale blue to red has a range of 2°C. Credit: NASA’s S-MODE team / Jeroen Molemaker
Today the S-MODE pilot experiment operated as we envisioned many months ago, with all platforms sampling data throughout the day over the area of interest. The field experiment crew is tired but happy and the team is excited about the science that we will extract from this data set.
Goodnight moon. NASA King Air B200 on arrival at Moffett Field, California after a long day of flights. Photo credit: Alex Wineteer / NASA Jet Propulsion Laboratory
11/05/21
Today is the final day of the S-MODE pilot campaign. It’s a bittersweet feeling for me as it was so much fun to collaborate and coordinate daily activities with so many people. I will miss that, but I certainly will not miss the hectic calls of “we have a problem with …”
The NASA King Air B200 will fly in the afternoon collecting data in the western region of the S-MODE study area together with the Twin Otter aircraft. Meanwhile, our friends on the ship will start recovering the autonomous assets and make their way toward Newport, Oregon.
Trouble struck again as our GPS unit could not get itself aligned and produce a good navigation solution, requiring a power reset and making S-turns i.e. banking the aircraft left and right in succession. After this excitement things went smoothly for the rest of the flight. You never know what will go wrong during a field deployment, you just know that something will and you need to be prepared to react and fix things without letting the panic set in! Thankfully that is what happened today thanks to Alex Winteer, a DopplerScatt operator from NASA JPL. He performed a cool and collected power reset while in air!
Happy crew on their last flight of the S-MODE pilot campaign. On the left is Jeroen Molemaker (UCLA MOSES operator) and on the right is Alex Wineteer (JPL DopplerScatt operator). Photo credit: Karthik Srinivasan / NASA JPL
Now it is time to work on our post-deployment to do list and eagerly await results of data processing.
I will leave you with two short blurbs from DopplerScatt team members Alex and Karthik about their impressions of the pilot campaign.
“On most days, you don’t wake up looking forward to a boring day. As an instrument operator, a boring day during a deployment, however, is a different story. You look forward to sitting in a small round aluminum tube for 4.5 hours with nothing to do. That is a perfect day – a day when the radar just works. No last minute excitement of monitors not turning on (because someone unplugged it and forgot to plug it back in!) or the satellite phone connection not working. While the entire science team is excited about an action-packed day of coincident data collection, all the instrument operators look forward to is a day where everything just works as it should! Of course, sitting in an aluminum tube for many hours, staring out at the ocean with nothing to do makes you yearn for some excitement, but that is a fleeting thought until you get a text message via satellite link asking you to pay attention to the speed of the aircraft!”
– Karthik Srinivasan, NASA JPL DopplerScatt operator
“I’ve been on quite a few field deployments with DopplerScatt, but none quite as exciting – or as important—as this one. Indeed, such a coordinated effort consisting of multiple aircraft and many assets in the water has never been attempted, and the resulting science will lead to new understanding of our ocean, atmosphere and the climate system as a whole. On Thursday, we attempted two flights for the first time. I operated the first flight: crew brief at 6:30 AM with a takeoff time of 8 AM. Thankfully, our instrument operated normally, and we were able to fly a bit lower –under the clouds – to ensure MOSES could see the ocean surface with its infrared camera. We landed five hours later, at around 1 PM, and I immediately took our data back to our field processing center in the aircraft hangar to start crunching. In the meantime, Karthik took off for our second flight of the day. By the time I finished the first round of processing, it was 5 PM and Karthik was almost back from the second flight, so I went downstairs to welcome him back (and grab the data!). A few hours later, we had both flights processed to quick look data products and I was exhausted. Being just one person, a small part of a much larger mission, it can be easy to lose sight of why we do this, especially when the hours are long. But when the data started pouring in, my exhaustion was quickly replaced by excitement. We were seeing a dataset no one had ever seen before. With these two flights, we are able to not just see the sub-mesoscale structure of the ocean surface over a large area, but we could also see its evolution over time and how the atmosphere interacts with that evolution! There is much work to go in analyzing these data, especially in comparing the many other instruments to our DopplerScatt measurements, but I am grateful to play a part in that analysis, discovery and understanding.”
– Alex Wineteer, NASA JPL DopplerScatt operator
NASA’s TROPICS Pathfinder Satellite Produces Global First Light Images and Captures Hurricane Ida
On August 8, NASA’s TROPICS Pathfinder satellite captured global first light images as well as a look inside the structure of Hurricane Ida before and after it made landfall.
The satellite launched on June 30, 2021 as the pathfinder – or test – satellite for NASA’s Time-Resolved Observations of Precipitation structure and storm Intensity with a Constellation of Smallsats (TROPICS) mission. The Pathfinder satellite provides an opportunity to test the technology, communication systems, and data processing before the six satellites comprising the TROPICS constellation launch in 2022. “[Pathfinder] is like a dress rehearsal of the mission,” said Bill Blackwell, the principal investigator for the TROPICS mission and a researcher at the Massachusetts Institute of Technology Lincoln Laboratory in Lexington, Massachusetts.
The future TROPICS constellation will orbit Earth in three planes, collecting temperature, water vapor, precipitation, and cloud ice measurements on a frequent, near-global scale to study storms and other meteorological events. The idea is that multiple satellites in spread out orbits will collect more frequent measurements around the globe, allowing scientists to study storms as they develop and then use the newly-acquired knowledge to improve forecasting capabilities. The TROPICS research team includes researchers from NASA, the National Oceanic and Atmospheric Administration (NOAA), and several universities and commercial partners.
“Early in the mission, the Pathfinder satellite has already demonstrated the usefulness of this data – especially the images of Hurricane Ida. We’re able to see a lot of features that we want to study with the TROPICS constellation,” said Blackwell.
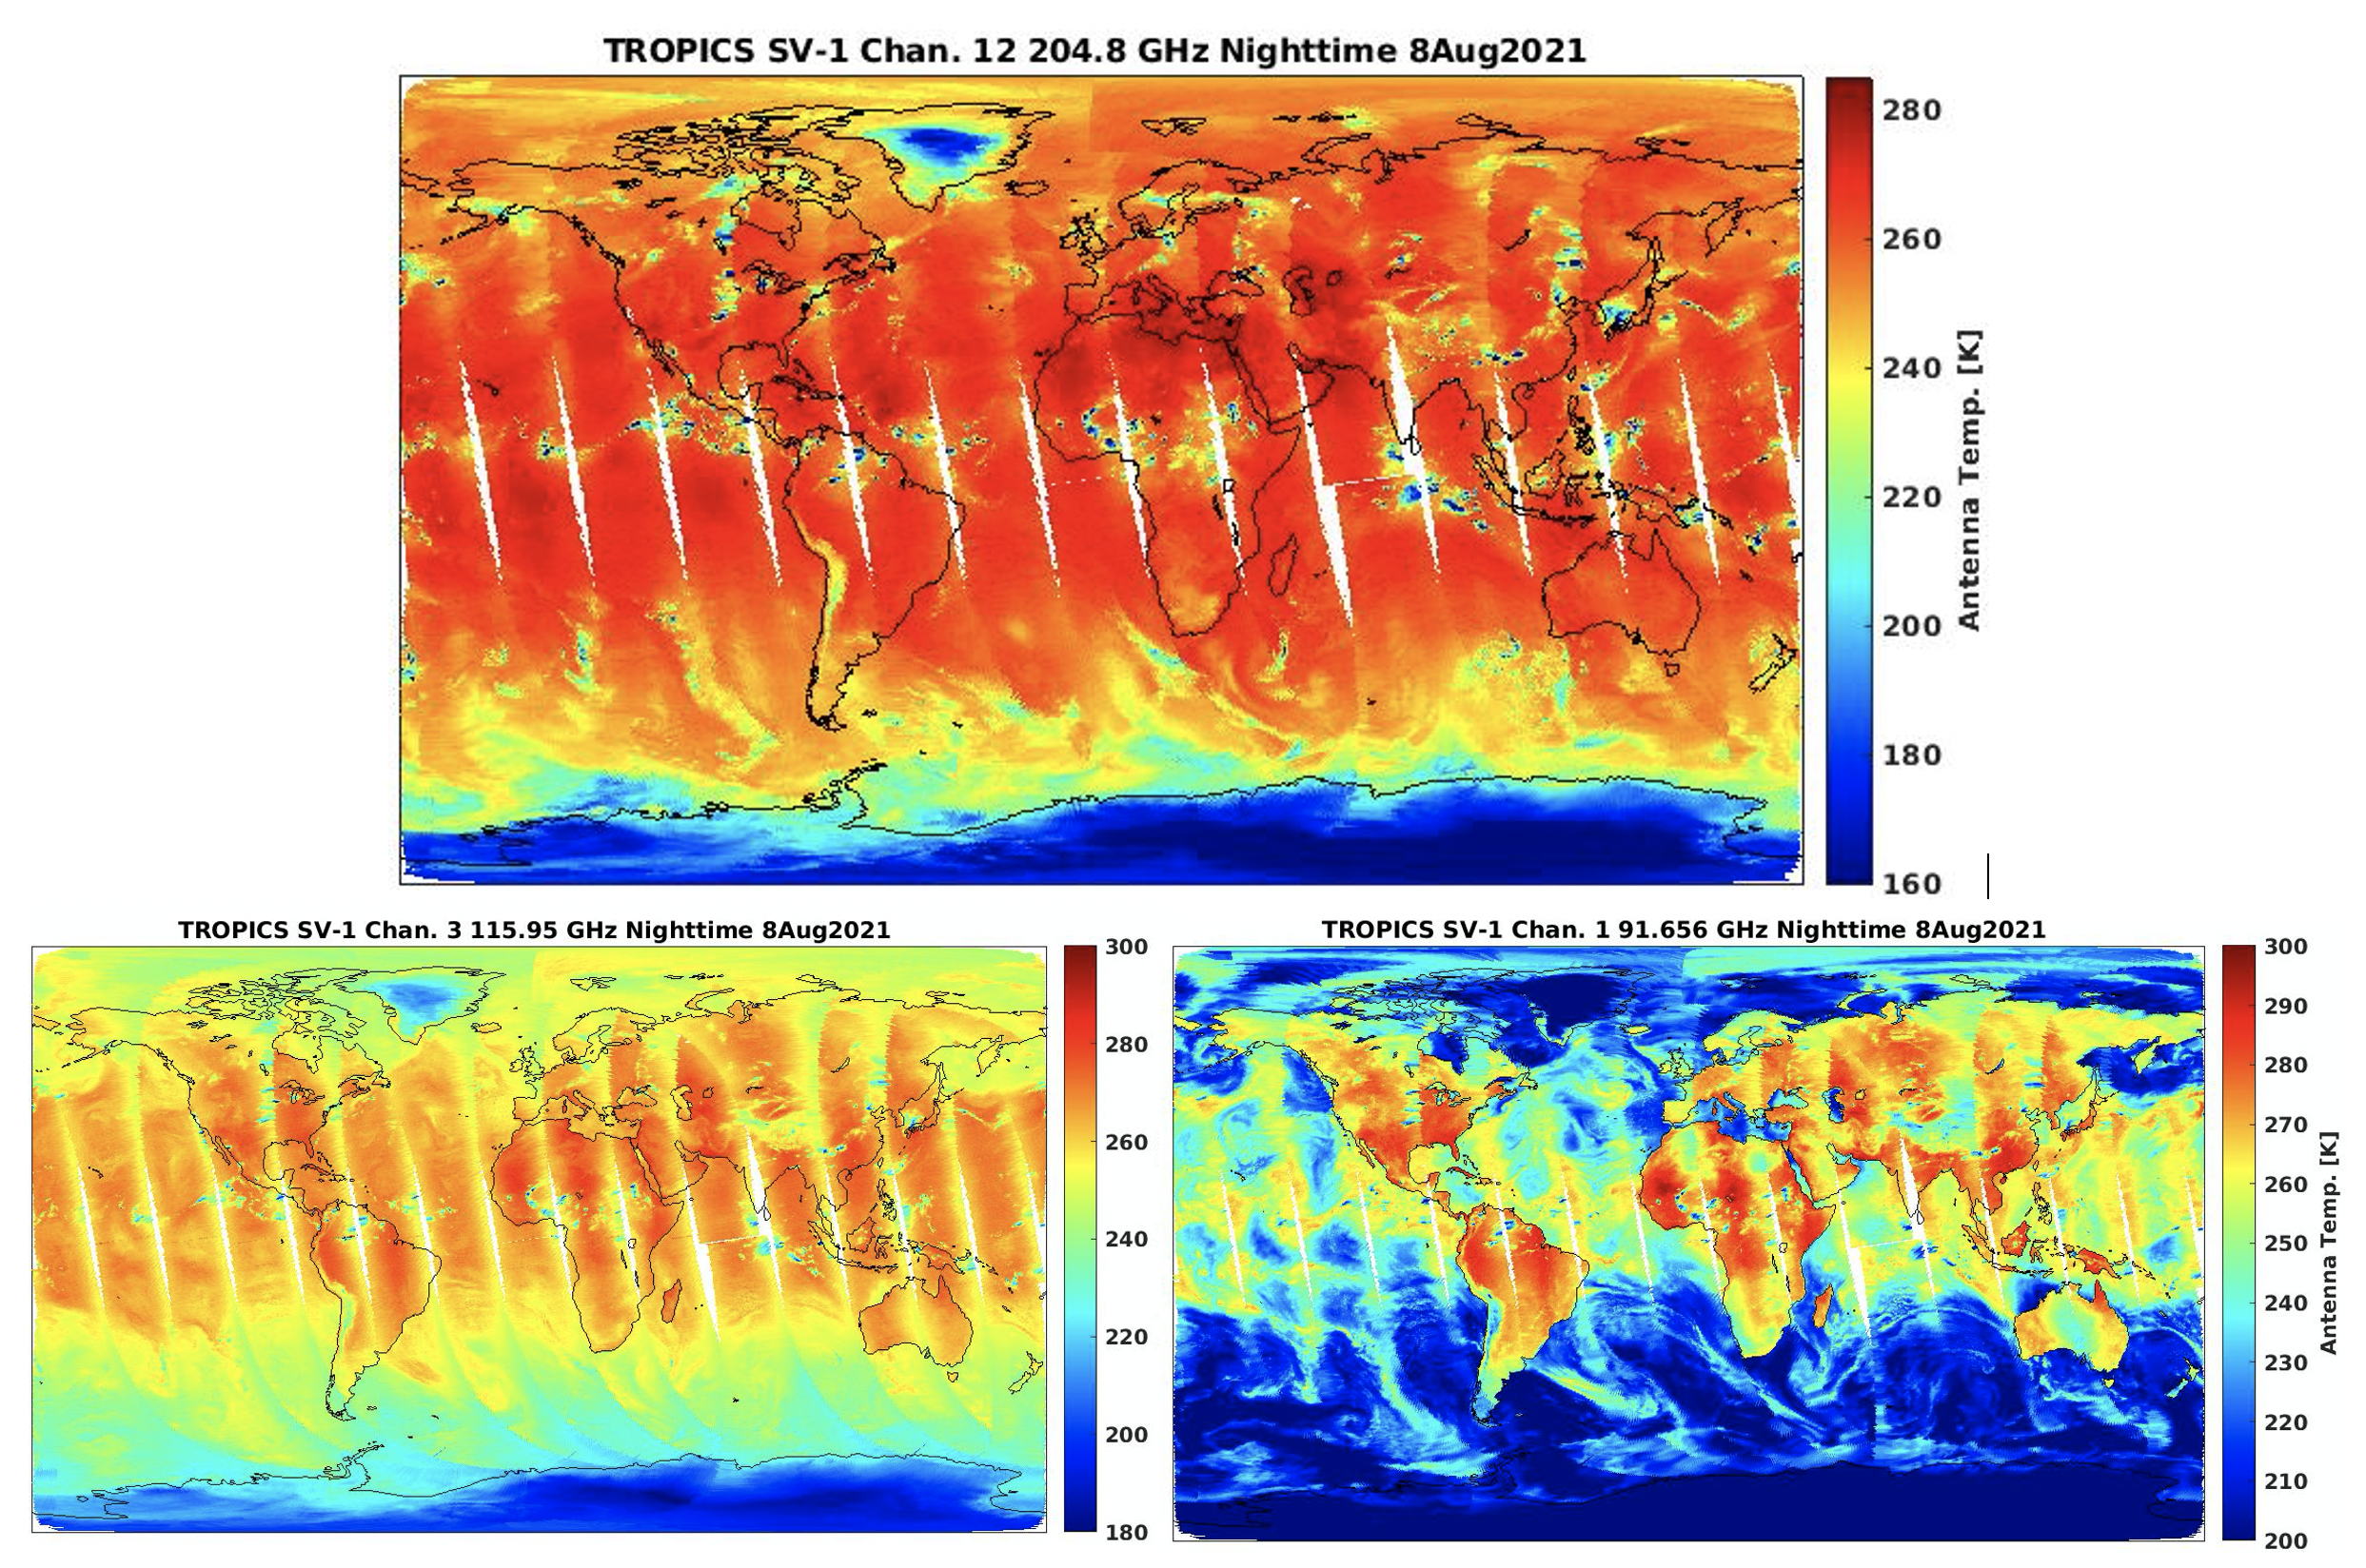
Three images produced by the TROPICS Pathfinder satellite using different frequencies.
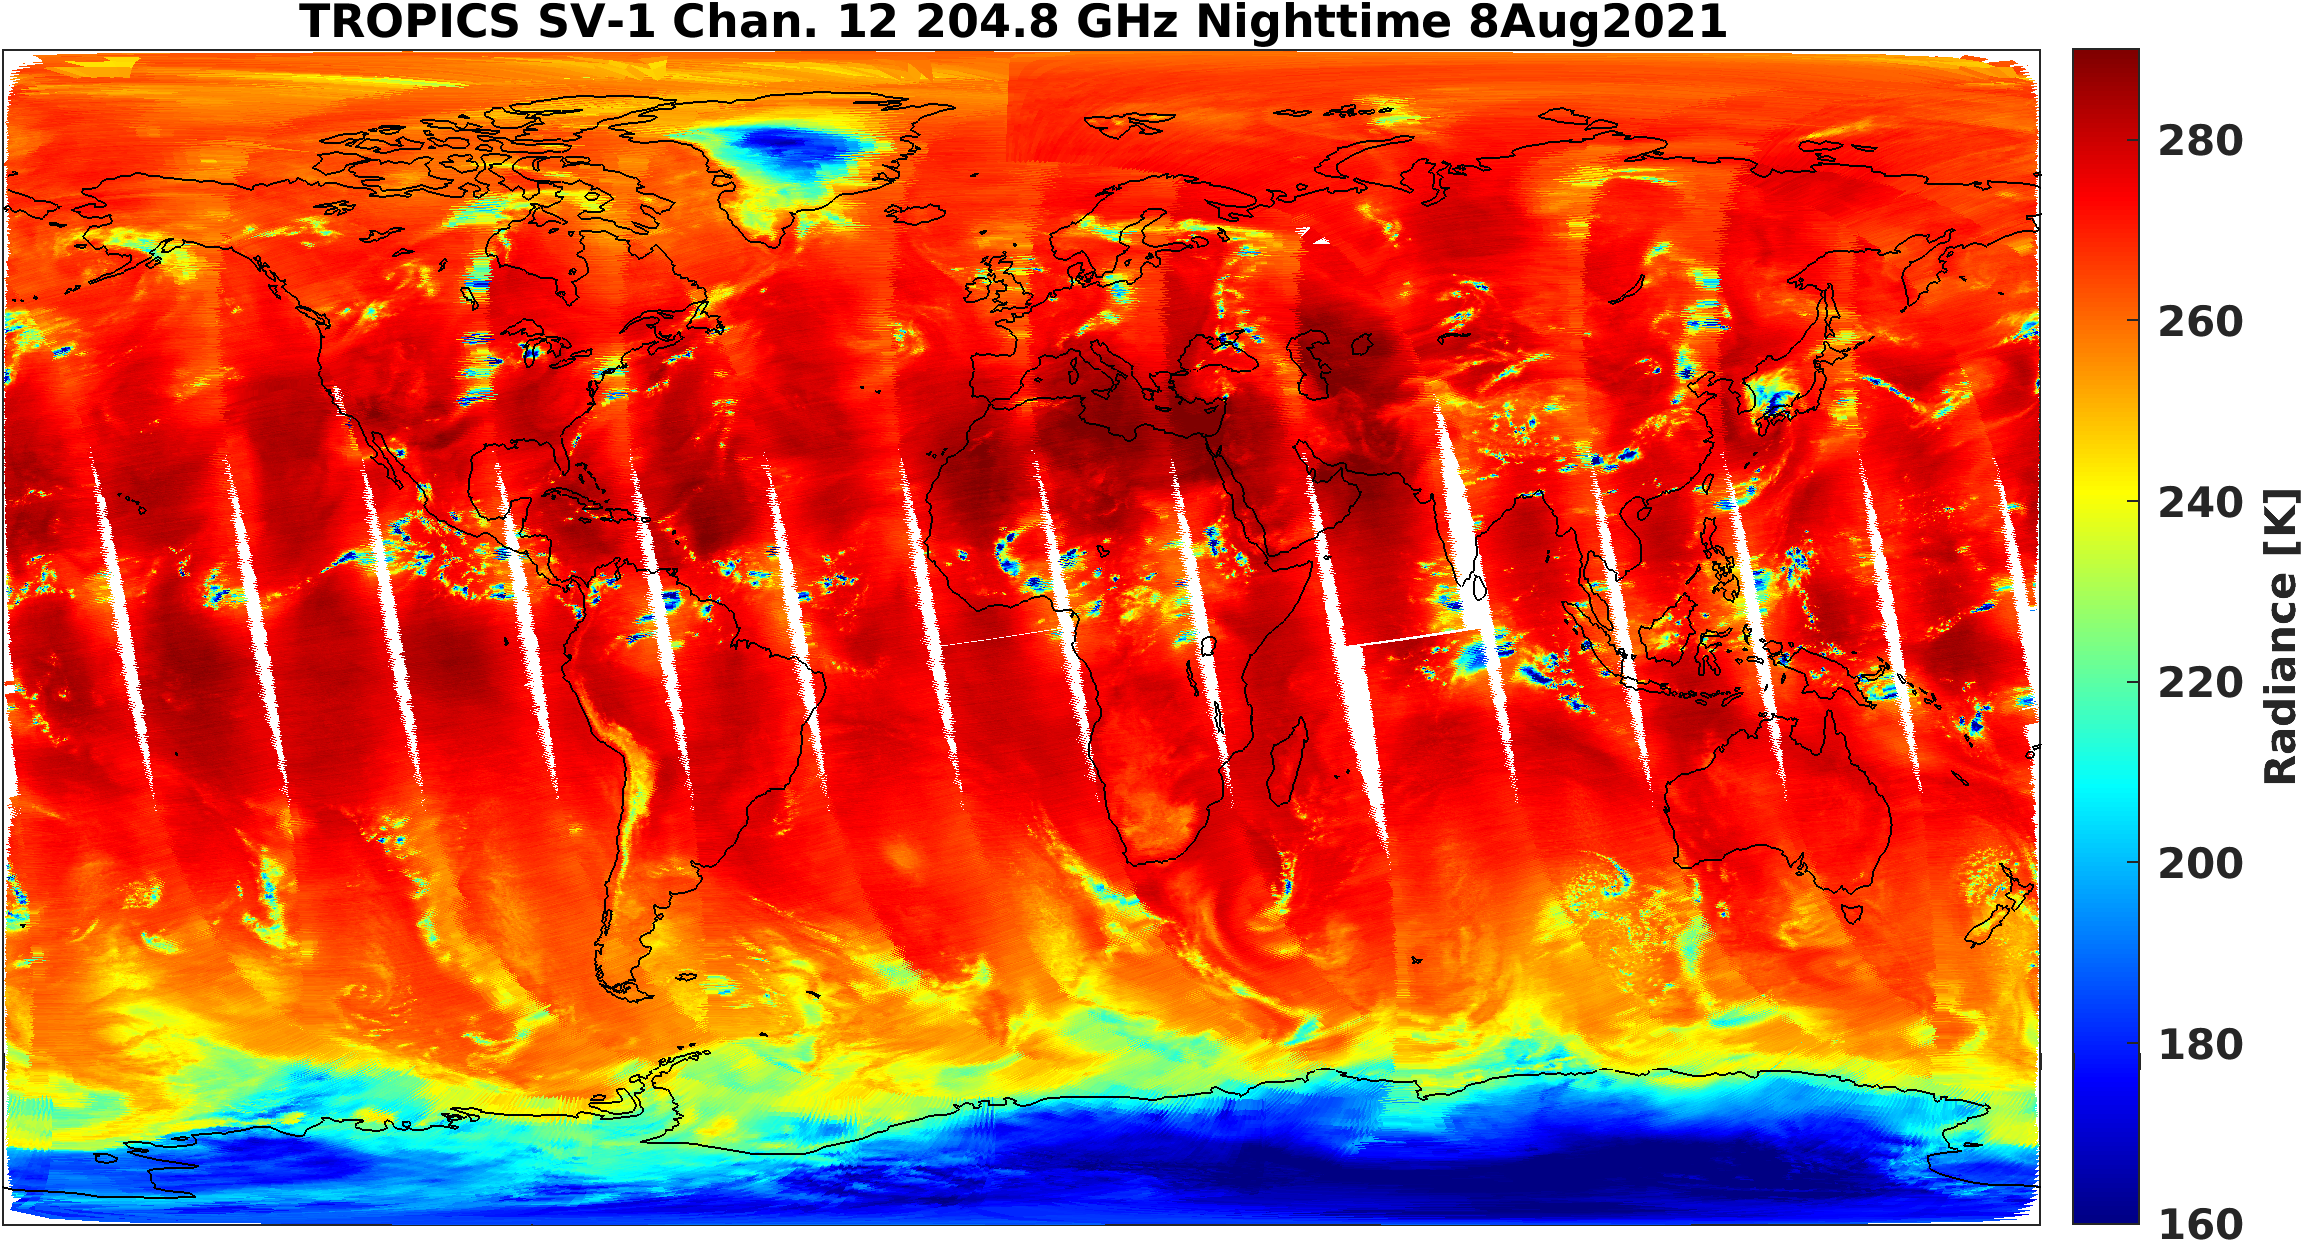
The TROPICS Pathfinder satellite captured its first global data on August 8, 2021, including a channel around 205 GHz (top). It’s the first time a frequency higher than 190 GHz has been used on a space-borne microwave cross-track sounder instrument, which collects temperature and water vapor data using microwave radiance observations.
Credits: NASA / TROPICS Pathfinder satellite
The global first light images show microwave data collected at several frequencies, each giving scientists a different piece of the larger puzzle of thermodynamics in Earth’s atmosphere. The image, comprised of 91 GHz data, shows water vapor, including swirls of atmospheric moisture over the ocean. The data from the 115 GHz frequency provides measurements of temperature at Earth’s surface and in the lower atmosphere. The 205 GHz data yields measurements of the precipitation-sized ice particles contained within clouds. “This is the first time we’ve flown a microwave cross-track sounder using that high of a frequency,” said Blackwell. The microwave cross-track sounder is an instrument that collects temperature and water vapor data using microwave radiance observations. “It’s very sensitive to observe ice in the cloud tops, which can give us an indication of the intensity of a storm.”
TROPICS Pathfinder also captured images of Hurricane Ida on August 28 and 29, just before and after the storm made landfall in Louisiana. Read the full story about these images on the NASA Applied Sciences website.
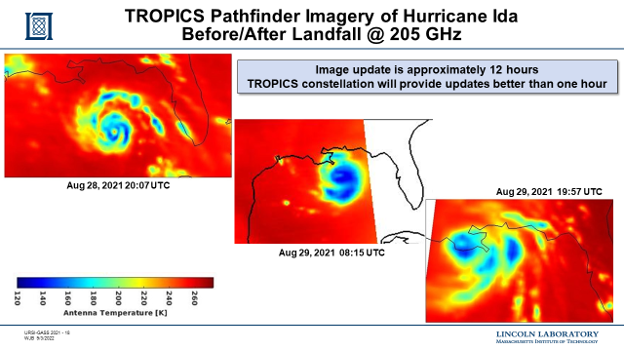
Images of Hurricane Ida before landfall (left) show a well-defined eye of the storm, as well as inner and outer rainbands that persisted as the storm made landfall in Louisiana (right).
Images of Hurricane Ida before landfall (left) show a well-defined eye of the storm, as well as inner and outer rainbands that persisted as the storm made landfall in Louisiana (right).
Credits: NASA / TROPICS Pathfinder satellite
“What the constellation will give us that we don’t have today is higher revisit rates – so we’ll be able to observe storms from space at microwave frequencies much more frequently than we can now,” said Blackwell.
By Sofie Bates
NASA’s Earth Science News Team
Link to original article NASA’s TROPICS Pathfinder Satellite Produces Global First Light Images and Captures Hurricane Ida
Storm (outflow) chasing high up in the stratosphere
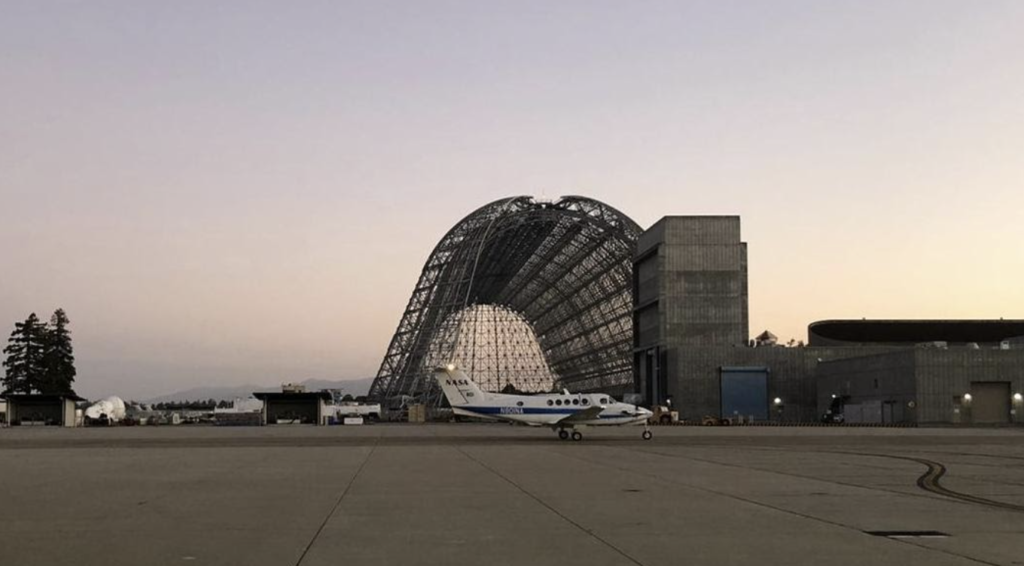
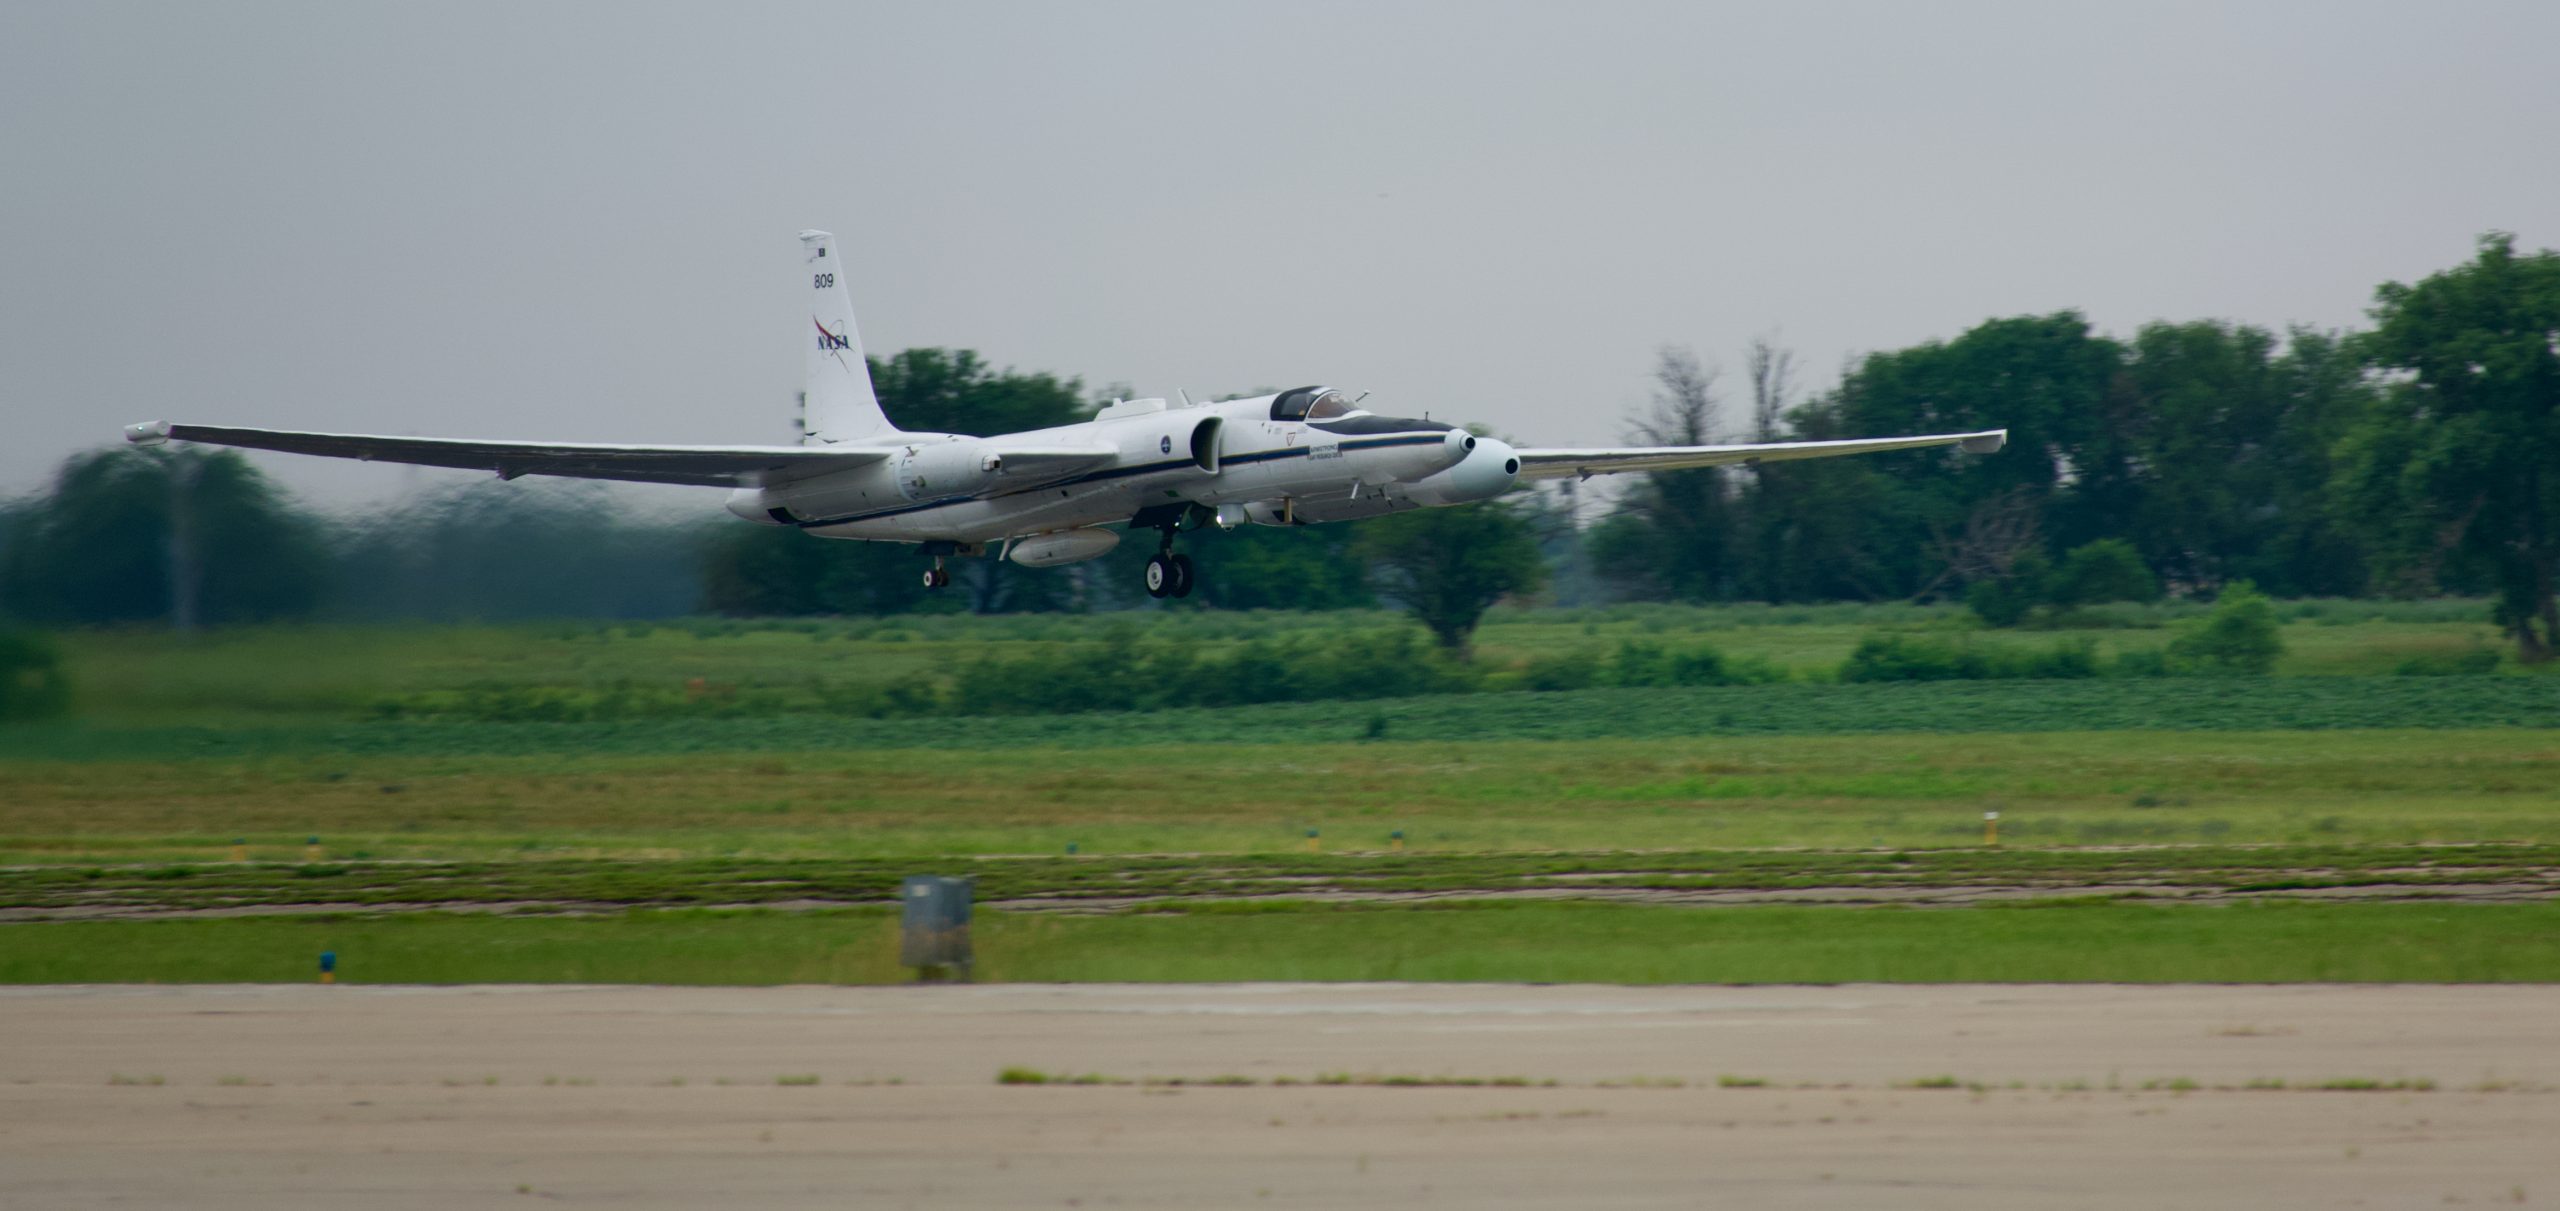 ER-2 takeoff on 16 July 2021 for DCOTSS Research Flight 01. Photo credit: Dan Chirica
By Rei Ueyama, NASA Ames Research Center /SALINA, KANSAS/
It’s 3 a.m. in Salina, Kansas. The moon is out. Crickets are chirping on this balmy summer night. The light above the door to the hangar softly illuminates the sign that reads “DCOTSS.” Most teammates are just waking up. I unlock the door and walk in to be the first to start this long but exciting day full of new discoveries. It’s yet another start of a typical day of a forecaster for the NASA Dynamics and Chemistry of the Summer Stratosphere (DCOTSS) field campaign.
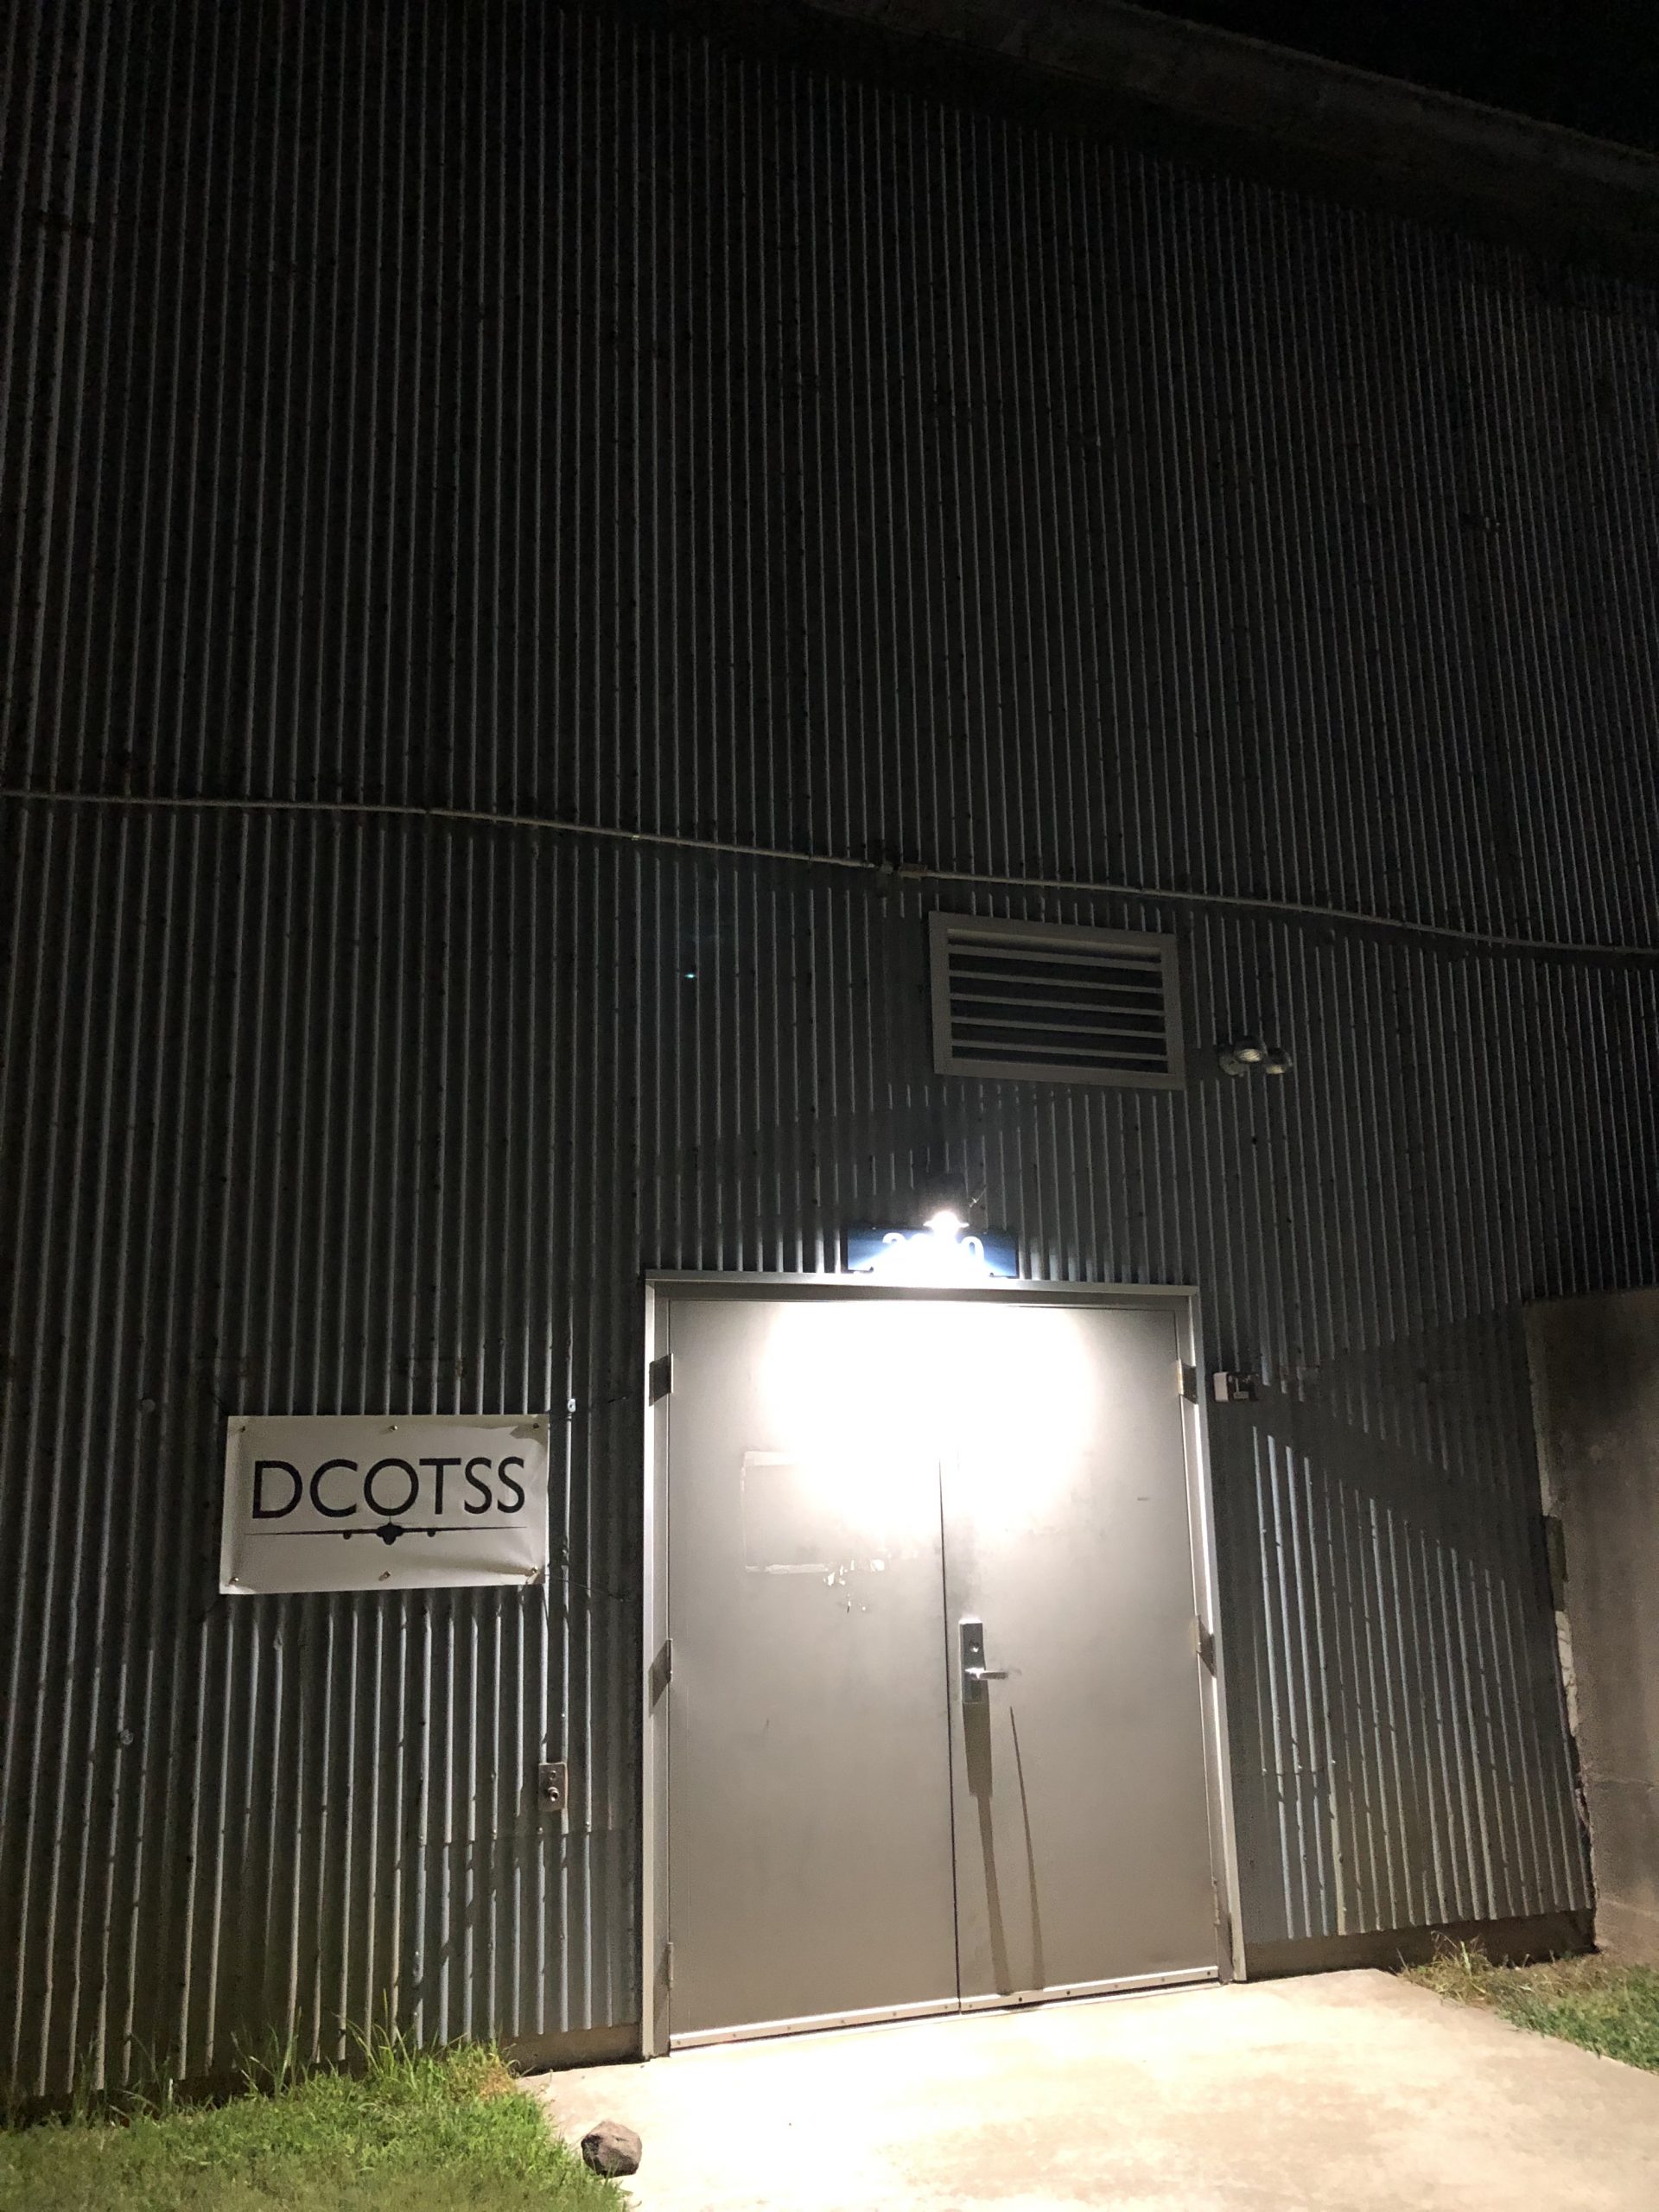 A picture of the door to the hangar taken by me (Rei Ueyama) on the morning of DCOTSS Research Flight 04 on 26 July 2021.
About 50 of us have gathered here (and 20 more to arrive later) in the middle of the continental United States in search of strong convective storms that penetrate high into the atmosphere. These so-called overshooting storms carry water and pollutants from the boundary layer and troposphere (where we live) into the atmospheric layer above us called the stratosphere. Small turrets at the top of these strong storms overshoot into the stratosphere, and hence its name “overshoots”.
The stratosphere is a much different environment than the troposphere. For one, it is extremely dry. It also has many molecules of ozone that make up the ozone layer which protects us from harmful ultraviolet rays. Various materials pumped up from the troposphere into the stratosphere by these overshooting storms may alter the chemistry and composition of the stratosphere, which could ultimately affect Earth’s climate quite significantly. So we’re here to find out exactly how and to what extent these strong convective storms influence our climate.
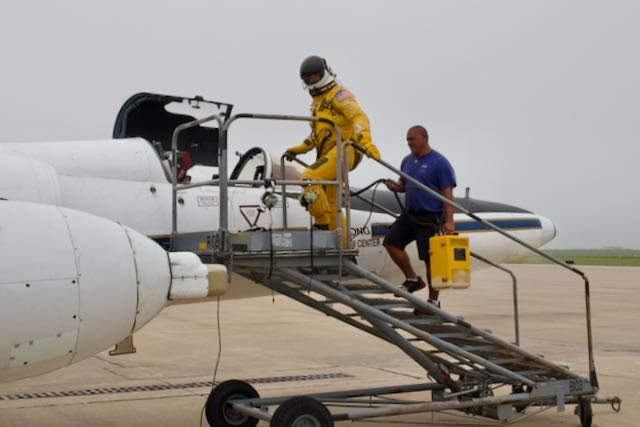 ER-2 pilot (Greg “Coach” Nelson) stepping into the aircraft for DCOTSS Research Flight 01 on 16 July 2021. Photo credit: Dan Chirica
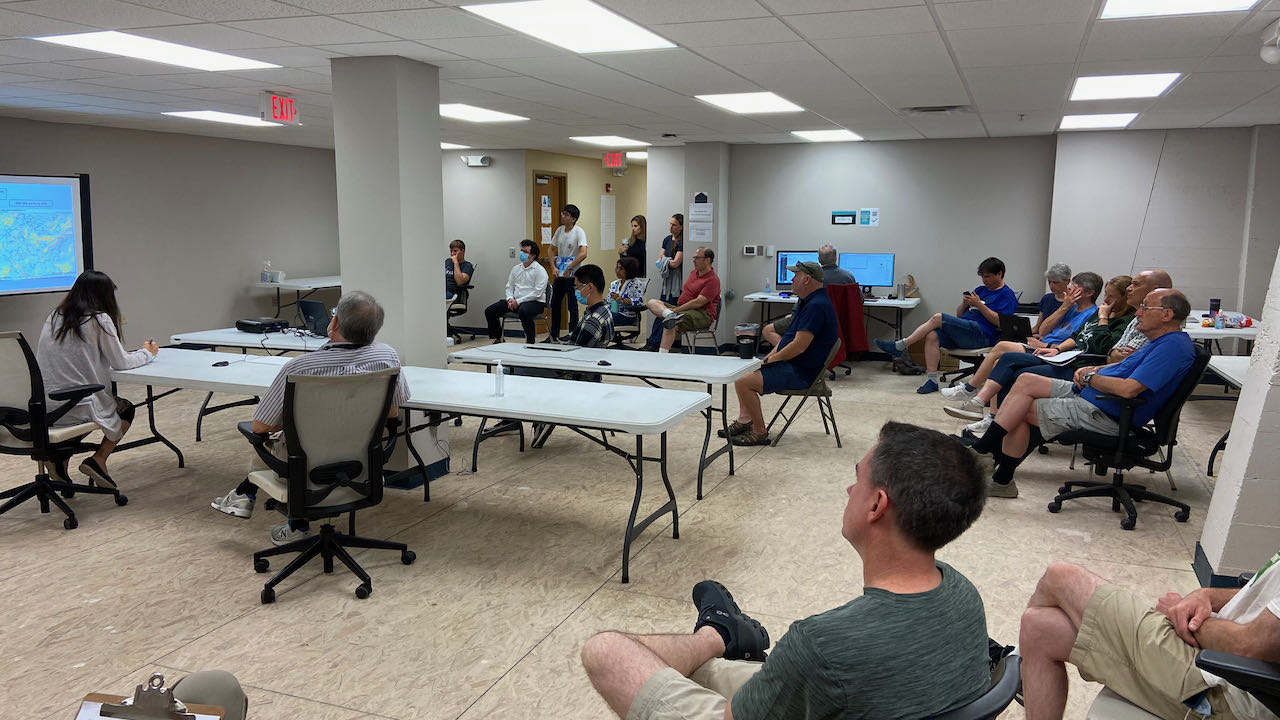 A picture of forecasting and flight planning meeting on the morning of 15 July 2021. I am sitting in the front left corner (my back facing the camera), leading the meeting. Photo credit: Dan Chirica
My role in DCOTSS is to lead a group of forecasters and flight planners to provide our best assessment of where the outflow plumes from overshooting storms may be located on the day of a science flight and then design a flight plan to sample those plumes. This is no easy feat as these plumes of overshooting material are often tenuous and sparse such that our effort often feels like a search for a diamond in a haystack.
As we rub our just-awoken eyes and scrutinize the early morning images of overshooting plume forecasts from satellite and radar-based models, the instrument scientists begin to arrive at the hangar to prepare their instruments for a 6 to 7 hour flight. The flight plan is tweaked, the pilot is briefed, and we are ready to go.
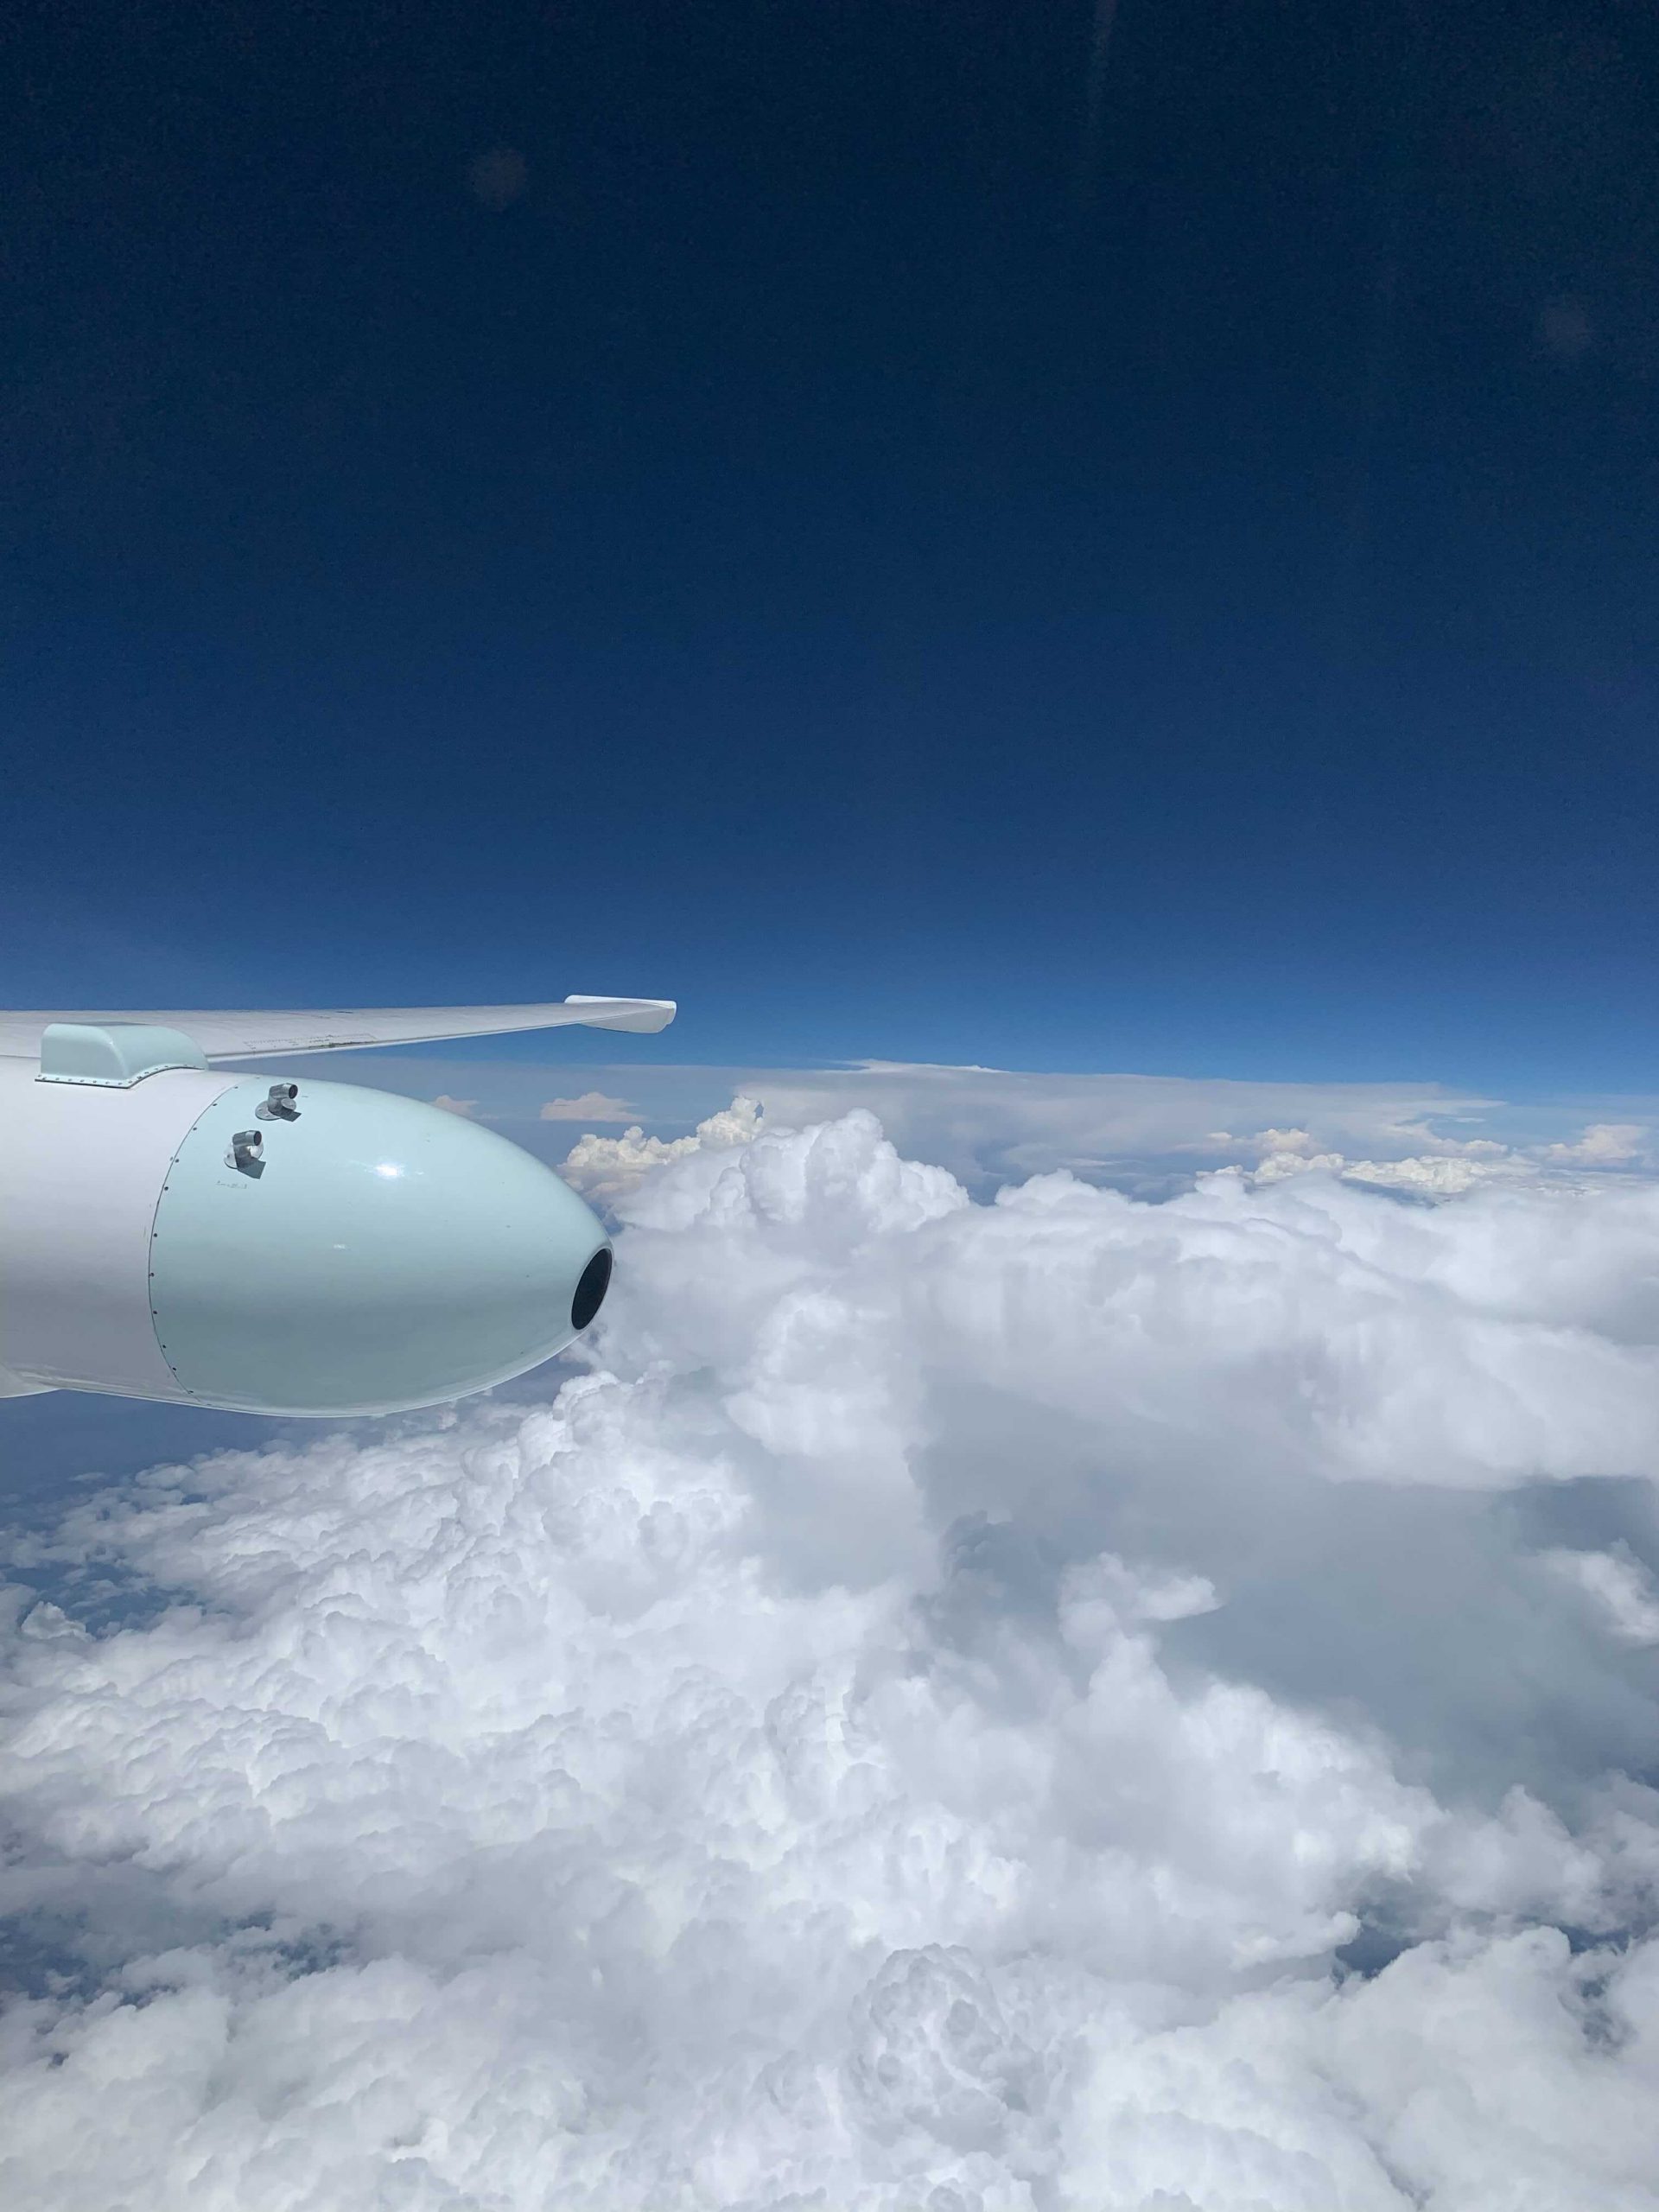 A picture of non-overshooting convective storms reaching up to 45 kft taken by the pilot (Gary “Thor” Toroni) on DCOTSS Research Flight 02 on 20 July 2021. Photo credit: Gary “Thor” Toroni
Watching the pilot navigate the ER-2 just as we had planned is very humbling and satisfying. But at the same time, our nerves are running high as the measurements from the instruments start to trickle in from the aircraft to the mission operation center on the ground. How good was our plume forecast? Do we see any indication in the measurements that the ER-2 had actually flown through a convective plume? On many occasions, it’s too early to tell. The diamond usually only shines through after the flight has been completed and after a thorough analysis of the collective measurements. Yet we are glued to our computer screens, holding our breath as we look for any signs of a convective plume in the real-time measurements.
Our job is mostly done for today, but there is no reprieve. We now look into the future to plan our next science flight. Time to hunt for another overshooting storm!
WIRED Magazine Article -“Tiny Satellites Could Help Warn of the Next Big Hurricane”
WIRED Magazine published a fantastic article explaining the importance of TROPICS and key science and societal benefit that TROPICS and the Pathfinder will be conducting once on orbit. The following is the link to the article by Meghan Herbst
TEMPO Air Pollution Sensor Treks Toward Satellite Integration
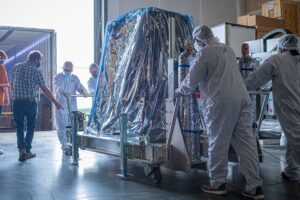
A crew at Ball Aerospace in Broomfield, Colorado, rolls the TEMPO satellite instrument onto a truck for shipment to Maxar Technologies’ satellite manufacturing facility in Palo Alto, California.
Credits: Ball Aerospace
A NASA satellite instrument that will measure air pollution over North America has reached another key project milestone. On Tuesday, May 18, The Tropospheric Emissions: Monitoring of Pollution (TEMPO), instrument, which will take hourly daytime measurements at an unprecedented spatial resolution shipped from Ball Aerospace in Broomfield, Colorado, to Maxar Technologies’ satellite manufacturing facility in Palo Alto, California, for integration onto the Intelsat 40e.
Ball completed building TEMPO in 2018. After its scheduled launch in 2022, the TEMPO instrument will make measurements of air pollution —including ozone, nitrogen dioxide and formaldehyde, and tiny atmospheric particles called aerosols — that can damage human health and the environment. Those measurements will reach from Puerto Rico and Mexico to northern Canada, and from the Atlantic to the Pacific, encompassing the entire lower 48 United States.
“This is an exciting time for the mission,” said Kevin Daugherty, TEMPO project manager at NASA’s Langley Research Center in Hampton, Virginia. “We are about to begin integrating the TEMPO instrument with our host satellite and undergo testing to ensure the satellite can survive the launch and environment of space prior to being launched into space.”
From its geostationary orbit — a high Earth orbit that allows satellites to match Earth’s rotation — TEMPO will also form part of an air quality satellite “virtual constellation” that will track pollution around the Northern Hemisphere. South Korea’s Geostationary Environment Monitoring Spectrometer (GEMS), the first instrument in the constellation, launched into space last year on the Korean Aerospace Research Institute GEO-KOMPSAT-2B satellite, and is measuring pollution over Asia. The European Space Agency Sentinel-4 satellite, expected to launch in 2023, will make measurements over Europe and North Africa.
Kelly Chance, of the Smithsonian Astrophysical Observatory in Cambridge, Massachusetts, is the principal investigator for TEMPO.
— NASA Langley Research Center
Credit: Joe Atkinson
link to original article TEMPO Air Pollution Sensor Treks Toward Satellite Integration
NASA’s S-MODE Takes to the Air and Sea to Study Ocean Eddies
After being delayed over a year due to the pandemic, a NASA field campaign to study the role of small-scale whirlpools and ocean currents in climate change is taking flight and taking to the seas in May 2021.
Using scientific instruments aboard a self-propelled ocean glider and several airplanes, this first deployment of the Sub-Mesoscale Ocean Dynamics Experiment (S-MODE) mission will deploy its suite of water- and air-borne instruments to ensure that they work together to show what’s happening just below the ocean’s surface. The full-fledged field campaign will begin in October 2021, with the aircraft based out of NASA’s Ames Research Center in Mountain View, California.
“This campaign in May is largely to compare different ways of measuring ocean surface currents so that we can have confidence in those measurements when we get to the pilot in October,” said Tom Farrar, associate scientist at the Woods Hole Oceanographic Institution in Massachusetts and principal investigator for S-MODE.
The S-MODE team hopes to learn more about small-scale movements of ocean water such as eddies. These whirlpools span about 6.2 miles or ten kilometers, slowly moving ocean water in a swirling pattern. Scientists think that these eddies play an important role in moving heat from the surface to the ocean layers below, and vice versa. In addition, the eddies may play a role in the exchange of heat, gases and nutrients between the ocean and Earth’s atmosphere. Understanding these small-scale eddies will help scientists better understand how Earth’s oceans slow down global climate change.
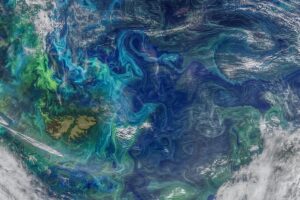
Sub-mesoscale ocean dynamics, like eddies and small currents, are responsible for the swirling pattern of these phytoplankton blooms (shown in green and light blue) in the South Atlantic Ocean on Jan. 5, 2021.
Credits: NASA’s Goddard Space Flight Center Ocean Color, using data from the NOAA-20 satellite and the joint NASA-NOAA Suomi NPP satellite.
A Self-Powered Surfboard, for Science!
The team is using a self-propelled commercial Wave Glider decked out with scientific instruments that can study the ocean from its surface. The most important gadgets aboard are the acoustic Doppler current profilers, which use sonar to measure water speed and gather information about the how fast the currents and eddies are moving, and in which direction. The glider also carries instruments to measure wind speed, air temperature and humidity, water temperature and salinity, and light and infrared radiation from the Sun.
“The wave glider looks like a surfboard with a big venetian blind under it,” said Farrar.
That “venetian blind” is submerged under the water, moving up and down with the ocean’s waves to propel the glider forward at about one mile per hour. In this way, the wave glider will be deployed from La Jolla, California, collecting data as it travels over 62 miles (100 kilometers) out into the ocean offshore of Santa Catalina Island.
Decked out with solar panels and several scientific instruments, the wave glider will propel itself from Santa Catalina Island farther out to sea.
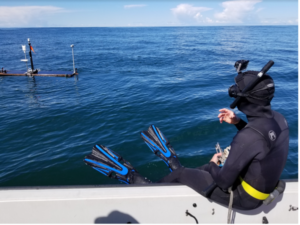
Laurent Grare of the Scripps Institution of Oceanography prepares to recover a Wave Glider during a pre-deployment test. Decked out with solar panels and several scientific instruments, the wave glider will propel itself from Santa Catalina Island farther out to sea.
Credits: Courtesy of Benjamin Greenwood / Woods Hole Oceanographic Institution
The new data will allow the scientists to estimate the exchange of heat and gases between Earth’s atmosphere and the ocean, and consequently better understand global climate change.
“We know the atmosphere is heating up. We know the winds are speeding up. But we don’t really understand where all that energy is going,” said Ernesto Rodriguez, research fellow at NASA’s Jet Propulsion Laboratory in Pasadena, California, and deputy principal investigator for the airborne parts of S-MODE. It’s likely that this energy is going into the ocean, but the details of how that process works are still unknown. The team thinks that small-scale eddies may help move heat from the atmosphere to the deeper layers of the ocean.
Eyes and Scientific Instruments in the Skies
While the Wave Glider continues its slow trek across the ocean’s surface, several airplanes will fly overhead to collect data from a different vantage.
“In an airplane, we can get a snapshot of a large area to see the context of how the bigger- and smaller-scale ocean movements interact,” said Rodriguez.
For example, a ship or wave glider travels slowly along a straight line, taking precise measurements of sea surface temperature at specific times and places. Airplanes move faster and can cover more ground, measuring the sea surface temperature of a large swath of ocean very quickly.
“It’s like taking an infrared image rather than using a thermometer,” explained Farrar.
A flight crew prepares for the B200 King Air Sub-Mesoscale Ocean Dynamics Experiment (S-MODE) at NASA’s Armstrong Flight Research Center in Edwards, California. From left to right are Jeroen Molemaker and Scott “Jelly” Howe.
Two planes will be used in the May test flights: a B200 plane from NASA’s Armstrong Flight Center in Edwards, California and a commercial plane from Twin Otter International. The B200 is carrying an instrument from NASA JPL called DopplerScatt to measure currents and winds near the ocean surface with radar. The Multiscale Observing System of the Ocean Surface (MOSES) instrument from the University of California, Los Angeles is also aboard to collect sea surface temperature data. On the Twin Otter plane is the Modular Aerial Sensing System (MASS) from the Scripps Institution of Oceanography at the University of California, San Diego, which is an instrument capable of measuring the height of waves on the surface of the ocean.
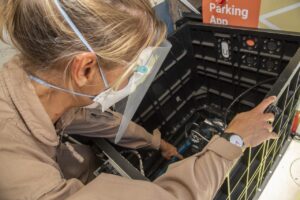
Delphine Hypolite, Multiscale Observing System of the Ocean Surface (MOSES) Operator from University of California Los Angeles, performs pre-flight checks on the MOSES Camera System at NASA’s Armstrong Flight Research Center in Edwards, California.
The fleet will gain a third member for the October experiments: NASA’s Langley Research Center Gulfstream III plane with JPL’s Portable Remote Imaging SpectroMeter (PRISM), an instrument to measure phytoplankton and other biological material in the water. The October deployments will also use a large ship and some autonomous sailing vessels, called Saildrones, in addition to planes and Wave Gliders.
After nearly a year and a half of delays due to the pandemic, the S-MODE team is excited to get their planes in the sky and the gliders in the water. “It was frustrating,” Rodriguez said, “but the science team hasn’t slowed down. The science keeps progressing.”
S-MODE is NASA’s ocean physics Earth Venture Suborbital-3 (EVS-3) mission, funded by the Earth System Science Pathfinder (ESSP) Program Office at NASA’s Langley Research Center in Hampton, Virginia, and managed by the Earth Science Project Office (ESPO) at Ames Research Center.
By Sofie Bates
NASA’s Earth Science News Team
Last Updated: May 19, 2021
Editor: Sofie Bates
Re-Posted from 0riginal Article