ER-2 takeoff on 16 July 2021 for DCOTSS Research Flight 01. Photo credit: Dan Chirica
By Rei Ueyama, NASA Ames Research Center /SALINA, KANSAS/
It’s 3 a.m. in Salina, Kansas. The moon is out. Crickets are chirping on this balmy summer night. The light above the door to the hangar softly illuminates the sign that reads “DCOTSS.” Most teammates are just waking up. I unlock the door and walk in to be the first to start this long but exciting day full of new discoveries. It’s yet another start of a typical day of a forecaster for the NASA Dynamics and Chemistry of the Summer Stratosphere (DCOTSS) field campaign.
A picture of the door to the hangar taken by me (Rei Ueyama) on the morning of DCOTSS Research Flight 04 on 26 July 2021.
About 50 of us have gathered here (and 20 more to arrive later) in the middle of the continental United States in search of strong convective storms that penetrate high into the atmosphere. These so-called overshooting storms carry water and pollutants from the boundary layer and troposphere (where we live) into the atmospheric layer above us called the stratosphere. Small turrets at the top of these strong storms overshoot into the stratosphere, and hence its name “overshoots”.
The stratosphere is a much different environment than the troposphere. For one, it is extremely dry. It also has many molecules of ozone that make up the ozone layer which protects us from harmful ultraviolet rays. Various materials pumped up from the troposphere into the stratosphere by these overshooting storms may alter the chemistry and composition of the stratosphere, which could ultimately affect Earth’s climate quite significantly. So we’re here to find out exactly how and to what extent these strong convective storms influence our climate.
ER-2 pilot (Greg “Coach” Nelson) stepping into the aircraft for DCOTSS Research Flight 01 on 16 July 2021. Photo credit: Dan Chirica
A picture of forecasting and flight planning meeting on the morning of 15 July 2021. I am sitting in the front left corner (my back facing the camera), leading the meeting. Photo credit: Dan Chirica
My role in DCOTSS is to lead a group of forecasters and flight planners to provide our best assessment of where the outflow plumes from overshooting storms may be located on the day of a science flight and then design a flight plan to sample those plumes. This is no easy feat as these plumes of overshooting material are often tenuous and sparse such that our effort often feels like a search for a diamond in a haystack.
As we rub our just-awoken eyes and scrutinize the early morning images of overshooting plume forecasts from satellite and radar-based models, the instrument scientists begin to arrive at the hangar to prepare their instruments for a 6 to 7 hour flight. The flight plan is tweaked, the pilot is briefed, and we are ready to go. A picture of non-overshooting convective storms reaching up to 45 kft taken by the pilot (Gary “Thor” Toroni) on DCOTSS Research Flight 02 on 20 July 2021. Photo credit: Gary “Thor” Toroni
Watching the pilot navigate the ER-2 just as we had planned is very humbling and satisfying. But at the same time, our nerves are running high as the measurements from the instruments start to trickle in from the aircraft to the mission operation center on the ground. How good was our plume forecast? Do we see any indication in the measurements that the ER-2 had actually flown through a convective plume? On many occasions, it’s too early to tell. The diamond usually only shines through after the flight has been completed and after a thorough analysis of the collective measurements. Yet we are glued to our computer screens, holding our breath as we look for any signs of a convective plume in the real-time measurements.
Our job is mostly done for today, but there is no reprieve. We now look into the future to plan our next science flight. Time to hunt for another overshooting storm!
Luckily, many of NASA’s Earth-observing satellites can see what the human eye can’t — including potentially harmful pollutants lingering in the air we breathe. From the vantage point of space, these satellites help us measure and track air pollution as it moves around the globe and have contributed significantly to our decades-long quest for cleaner air.
When we talk about “air pollution,” we’re referring to chemicals or particles in the atmosphere that are known to have negative health effects on humans. The Clean Air Act of 1970 established legislation that requires the tracking of six of those pollutants — nitrogen dioxide (NO2), ground-level ozone, carbon monoxide, particulate matter (microscopic specks of solid or liquid material in the air), sulfur dioxide, and lead. Satellite instruments are measuring all of these except lead.
NASA has been involved in the study of air quality for decades from space and with ground sensors, creating a time series of global data records critical to understanding the impacts and causes of air pollution and to helping design solutions. This article highlights a few of the many projects under way now and planned for the years to come.
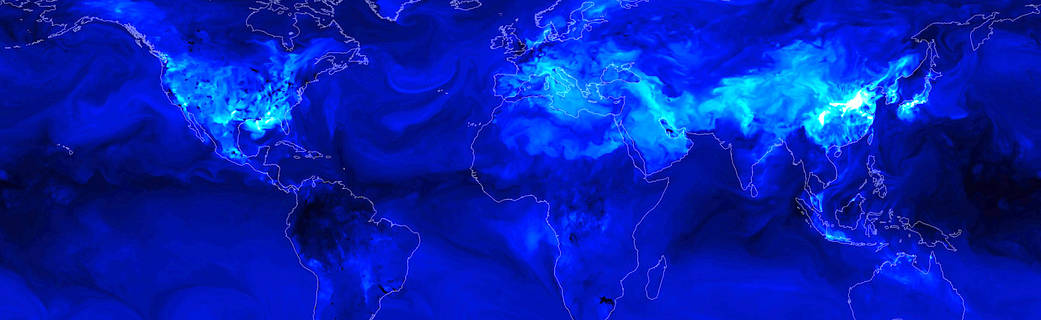
Air pollution can appear as a gray or orange haze enveloping a city. What the naked eye can’t see are the hundreds of chemical reactions taking place to produce that pollution. NASA science can reveal a more complete picture of atmospheric chemistry. Credits: NASA’s Goddard Space Flight Center/Scientific Visualization Studio Download This Video in HD from NASA Goddard’s Scientific Visualization Studio
Measured in Space, Used on Earth
In analyzing spaceborne data, one thing is abundantly clear — reducing emissions from human activities can have a profound effect on air quality.
China’s recent large-scale response to the COVID-19 pandemic, which included quarantines and limitations on industrial activities and travel, is a particularly vivid example of this. Data from instruments on NASA’s Aura and the European Space Agency’s Sentinel-5 satellites showed a significant decrease in nitrogen dioxide (NO2) — a noxious gas emitted by power plants, industrial facilities and motor vehicles — over much of the country during that time.
The pandemic presents a unique use-case for spaceborne Earth observations; however, satellite-derived air quality data have applications across a wide array of disciplines. That’s where NASA’s Health and Air Quality applications program demonstrates its value. The program builds invaluable partnerships with other agencies, industry and nonprofits to facilitate the use of this data in solving real world problems.
“We funded a project led by the Environmental Protection Agency (EPA) to assimilate NASA Earth observations into their “AirNow” system,” said program manager John Haynes.
The AirNow system is the EPA’s platform for distributing national, real-time air quality reports and forecasts. The measurements primarily come from thousands of monitoring stations on the ground across the United States, Mexico, and Canada; however, those ground monitoring stations are not all-encompassing.
“The ground monitors cover a good part of the U.S., especially around metropolitan areas. But there are large sections of the country that don’t have monitoring stations,” said Haynes. “By introducing satellite aerosol optical depth observations from the MODIS instrument, we can measure those areas too, which allows us to form a more accurate image of how air pollution — and specifically fine particulate matter — is distributed across the country and how it changes over time.”
By incorporating data from the Ozone Monitoring Instrument (OMI), a Dutch-Finnish contribution to NASA’s Aura satellite mission, the EPA and NASA were also able to identify a significant drop in NO2 over the last 15 years in the United States — evidence that regulations put into place by the Clean Air Act 50 years ago — vehicle gas mileage regulations, a shift to cleaner fuels, and so on — are, indeed, working.
“We’ve been able to show that since 2004, NO2 levels have dropped as much as 50% depending on what metropolitan area we’re talking about. In fact, the air in the United States is now the cleanest it has been in the modern industrial era,” Haynes said.
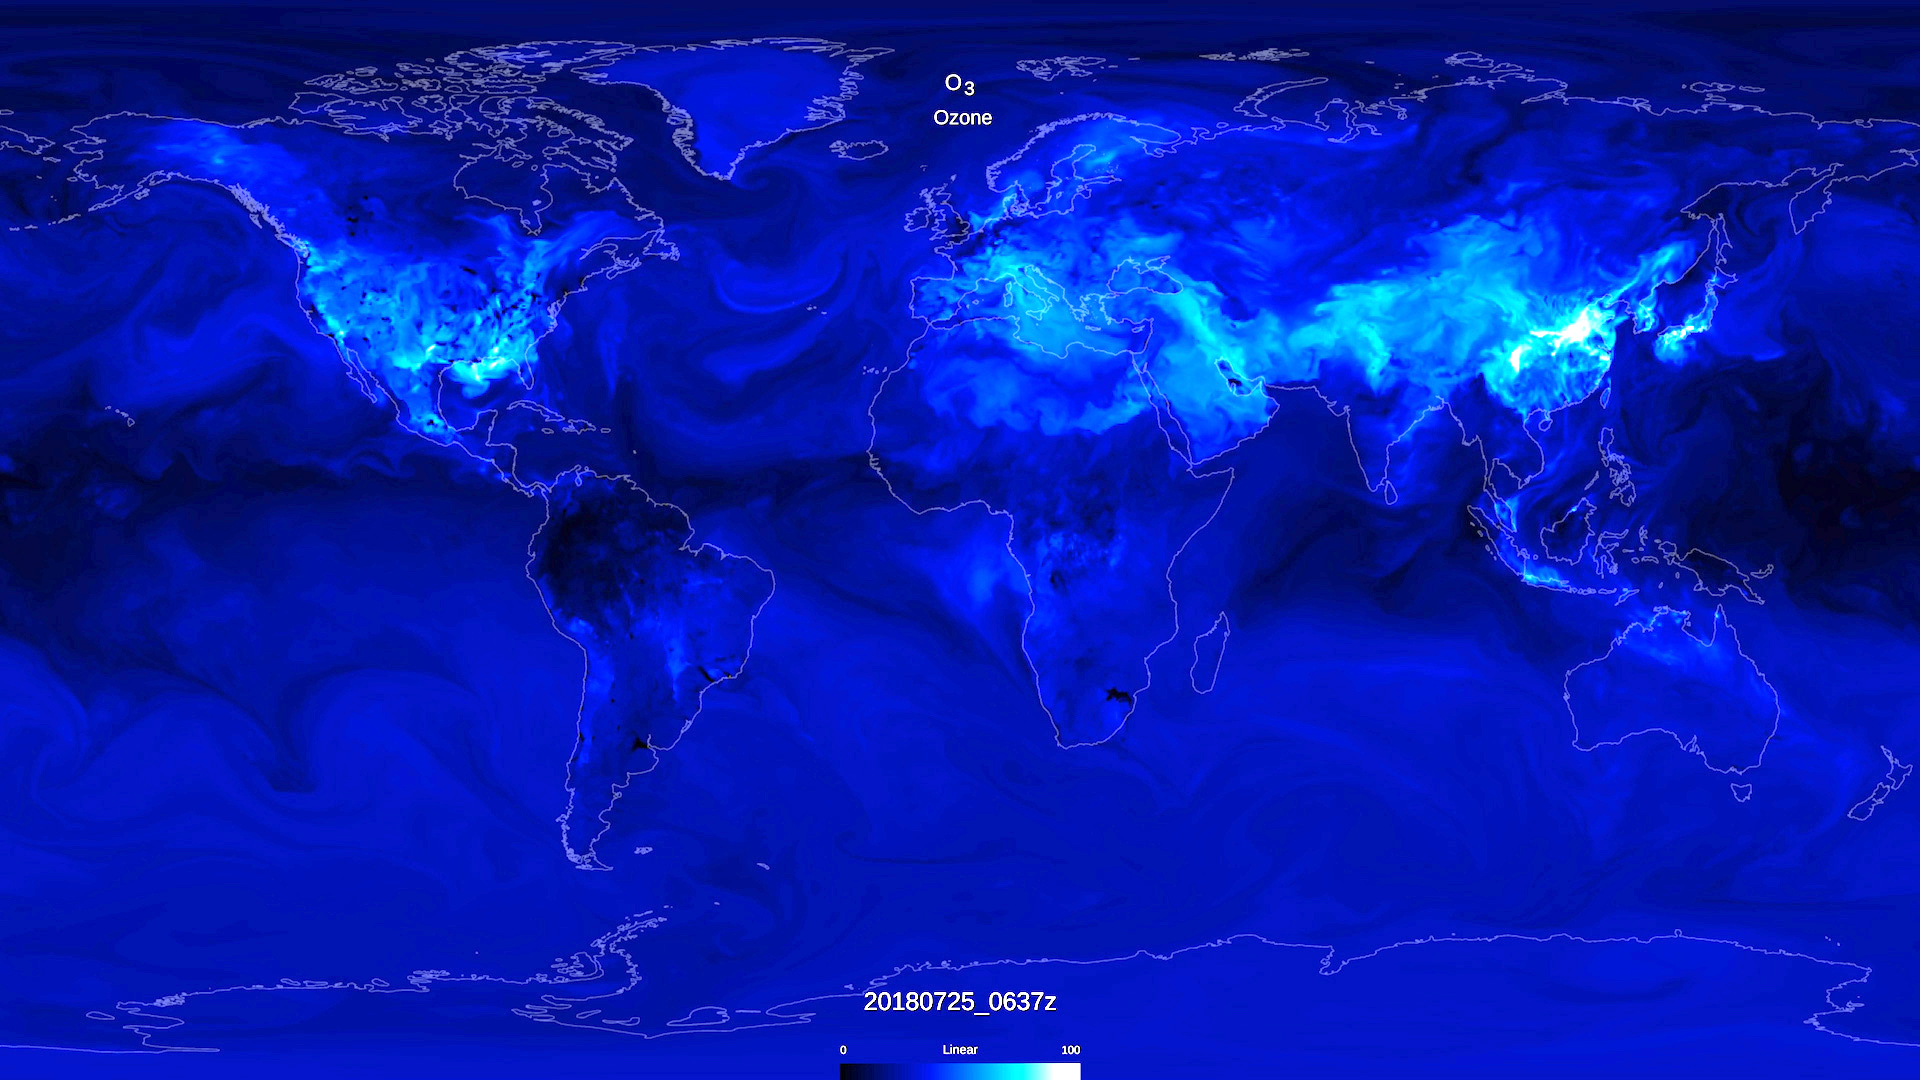
While ozone in the stratosphere is critical to maintaining life on Earth, surface ozone, shown here, is a toxic gas to most plant and animal species. NASA merges satellite data with models to provide a snapshot of chemistry throughout the atmosphere at any given time and help predict air quality worldwide. Credits: NASA’s Goddard Space Flight Center/Scientific Visualization Studio
Connecting the (data) dots
With the abundance of data coming in — there are dozens of Earth-observing satellites currently on orbit — one of the biggest challenges is connecting stakeholders with the right “tools” or datasets for what they’re trying to accomplish, and in some cases, teaching them how incorporate this type of data into their planning.
“To address this issue, our team has developed a website where we help users navigate all of these resources, from someone who has never really used satellite data before to more advanced stakeholders looking to make better decisions and inform the public on issues of air quality,” says Tracey Holloway, leader of the NASA-funded Health and Air Quality Applied Sciences Team (HAQAST), a group of air quality and public health scientists from government offices and universities across the country.
Wildfires in California, for example, have caused air quality concerns in recent years. A HAQAST tiger team was able to look at emissions and develop new methods for using existing data from the VIIRS and MODIS instruments to support the state of California in its understanding and quantification of emissions. HAQAST also helped to get data from newer satellites like GOES-16 into the state’s hands.
According to the Global Burden of Disease report, air pollution is the leading environmental cause of mortality — a statistic of which many in the public health sector are well aware. And the availability of satellite observations is changing the dialogue around it.
“Just within the health community, we have observed the growing trend of research collaborations that bridge expertise across environmental health disciplines. As we continue to train the global health workforce, we must identify the skillsets that can prepare the workforce to manage the emerging risks of the future. For example, one skillset is the knowledge and use of innovative data sources – including satellite data – whether they apply data for research purposes or interpret findings for educational outreach activities,” said Helena Chapman, associate program manager of NASA Health and Air Quality applications.
Holloway adds, “The abundance of satellite data right now is amazing. Just in the past 10 years, it’s been remarkable how many agencies, nonprofits, cities and states have gone from not even knowing satellites could detect air pollution to actively using the data in their day-to-day operations.”
Looking Ahead
Right now, our satellites can measure a number of chemicals in the air over the United States and globally on a daily basis. But several missions scheduled to launch in the next few years will be able to do even better.
For example, the Tropospheric Emissions: Monitoring Pollution (TEMPO) mission is designed to measure several different pollutants — including NO2 and ozone — over the United States during every daylight hour. TEMPO will give scientists the ability to see how pollution sources and concentrations change throughout the course of a day. Part of an international constellation of like satellites that includes South Korea’s Geostationary Environment Monitoring Spectrometer (GEMS), and the European Space Agency’s Sentinel-4, TEMPO is scheduled to launch in 2022.
The Multi-Angle Imager for Aerosols (MAIA) mission, also scheduled to launch in the early 2020s, will improve our understanding of particulate matter — those tiny, microscopic particles lingering in the air — with particular focus on large metropolitan areas. Data like this will help the health community better understand the connection between aerosol pollutants and health problems including adverse birth outcomes and cardiovascular diseases.
“MAIA will allow us to study these aerosols in detail, tell us how big they are and how many of them are in that very small category that is most harmful to human health,” said Barry Lefer, program scientist of NASA’s Tropospheric Composition program. “We’ll also be able to better understand what the particles are made of which will lead us to where they came from (like auto exhaust for example).”
Even further in the future, the possibilities are many.
“I’d love to see a future where real-time Earth observation data is seamlessly and continuously available to everyone — from orbit to the palm of your hand,” said Haynes. “It would allow anyone to make fast decisions regarding air quality and their health.”
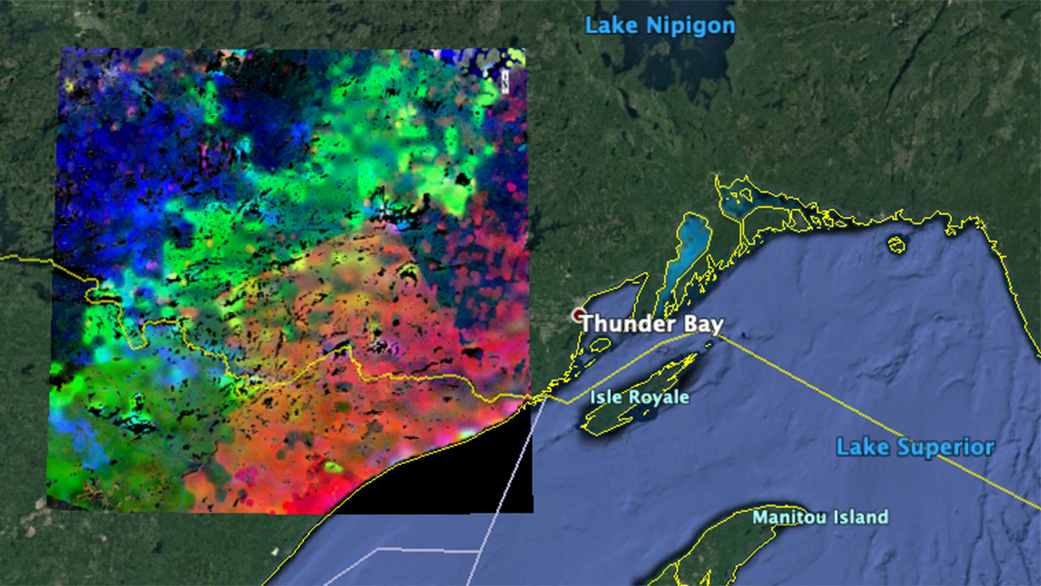
The image shows plants “waking up” near Lake Superior. Red areas began to wake up at around 7 a.m. local time; green areas awoke around 8 a.m.; and blue areas, at about 9 a.m. The data was acquired by ECOSTRESS during the summer season. Credits: NASA JPL
Like many people, plants are less active at night. The agency’s ‘space botanist’ can see when they begin to stir, and start their day.
Although plants don’t sleep in the same way humans do, they have circadian rhythms – internal clocks that, like our own internal clocks, tell them when it’s night and when it’s day. And like many people, plants are less active at night. When the Sun comes up, they kick into gear, absorbing sunlight to convert carbon dioxide they draw from the air and water they draw from the soil into food, a process called photosynthesis. They also “sweat” excess water through pores on their leaves to cool themselves down, a process called evapotranspiration.
NASA’s ECOsystem Spaceborne Thermal Radiometer on Space Station (ECOSTRESS) can see when plants “wake up” and begin these processes from space. The image above shows plants waking up (as evidenced by evapotranspiration) west of Lake Superior near the U.S.-Canada border. Plants in the red and pink areas began to awake at around 7 a.m. local time. Those in green areas awoke closer to 8 a.m., and those in blue areas, closer to 9 a.m.
ECOSTRESS launched to the International Space Station in June 2018. The space station’s unique orbit enables the instrument to capture data over the same areas at different times of day. When the mission team analyzes the data, they gain new insight into how plants behave throughout the course of a day.
For this image, the mission team collected and combined all of ECOSTRESS’s morning data for the summer season. In doing so, they observed that the earliest risers were near the lake, with plant activity spreading gradually northwestward as the morning progressed.
ECOSTRESS’ ability to detect plant behavior in this way can be especially helpful to resource managers and farmers, who can use the data to determine how much water their crops need, which ones are most water-efficient and which ones aren’t getting enough water, even before they show visible signs of dehydration. What’s more, the instrument can provide this data on a global scale over areas as small as a football field.
NASA’s Jet Propulsion Laboratory in Pasadena, California, built and manages the ECOSTRESS mission for the Earth Science Division in the Science Mission Directorate at NASA Headquarters in Washington. ECOSTRESS is an Earth Venture Instrument mission; the program is managed by NASA’s Earth System Science Pathfinder program at NASA’s Langley Research Center in Hampton, Virginia.
More information about ECOSTRESS is available here:
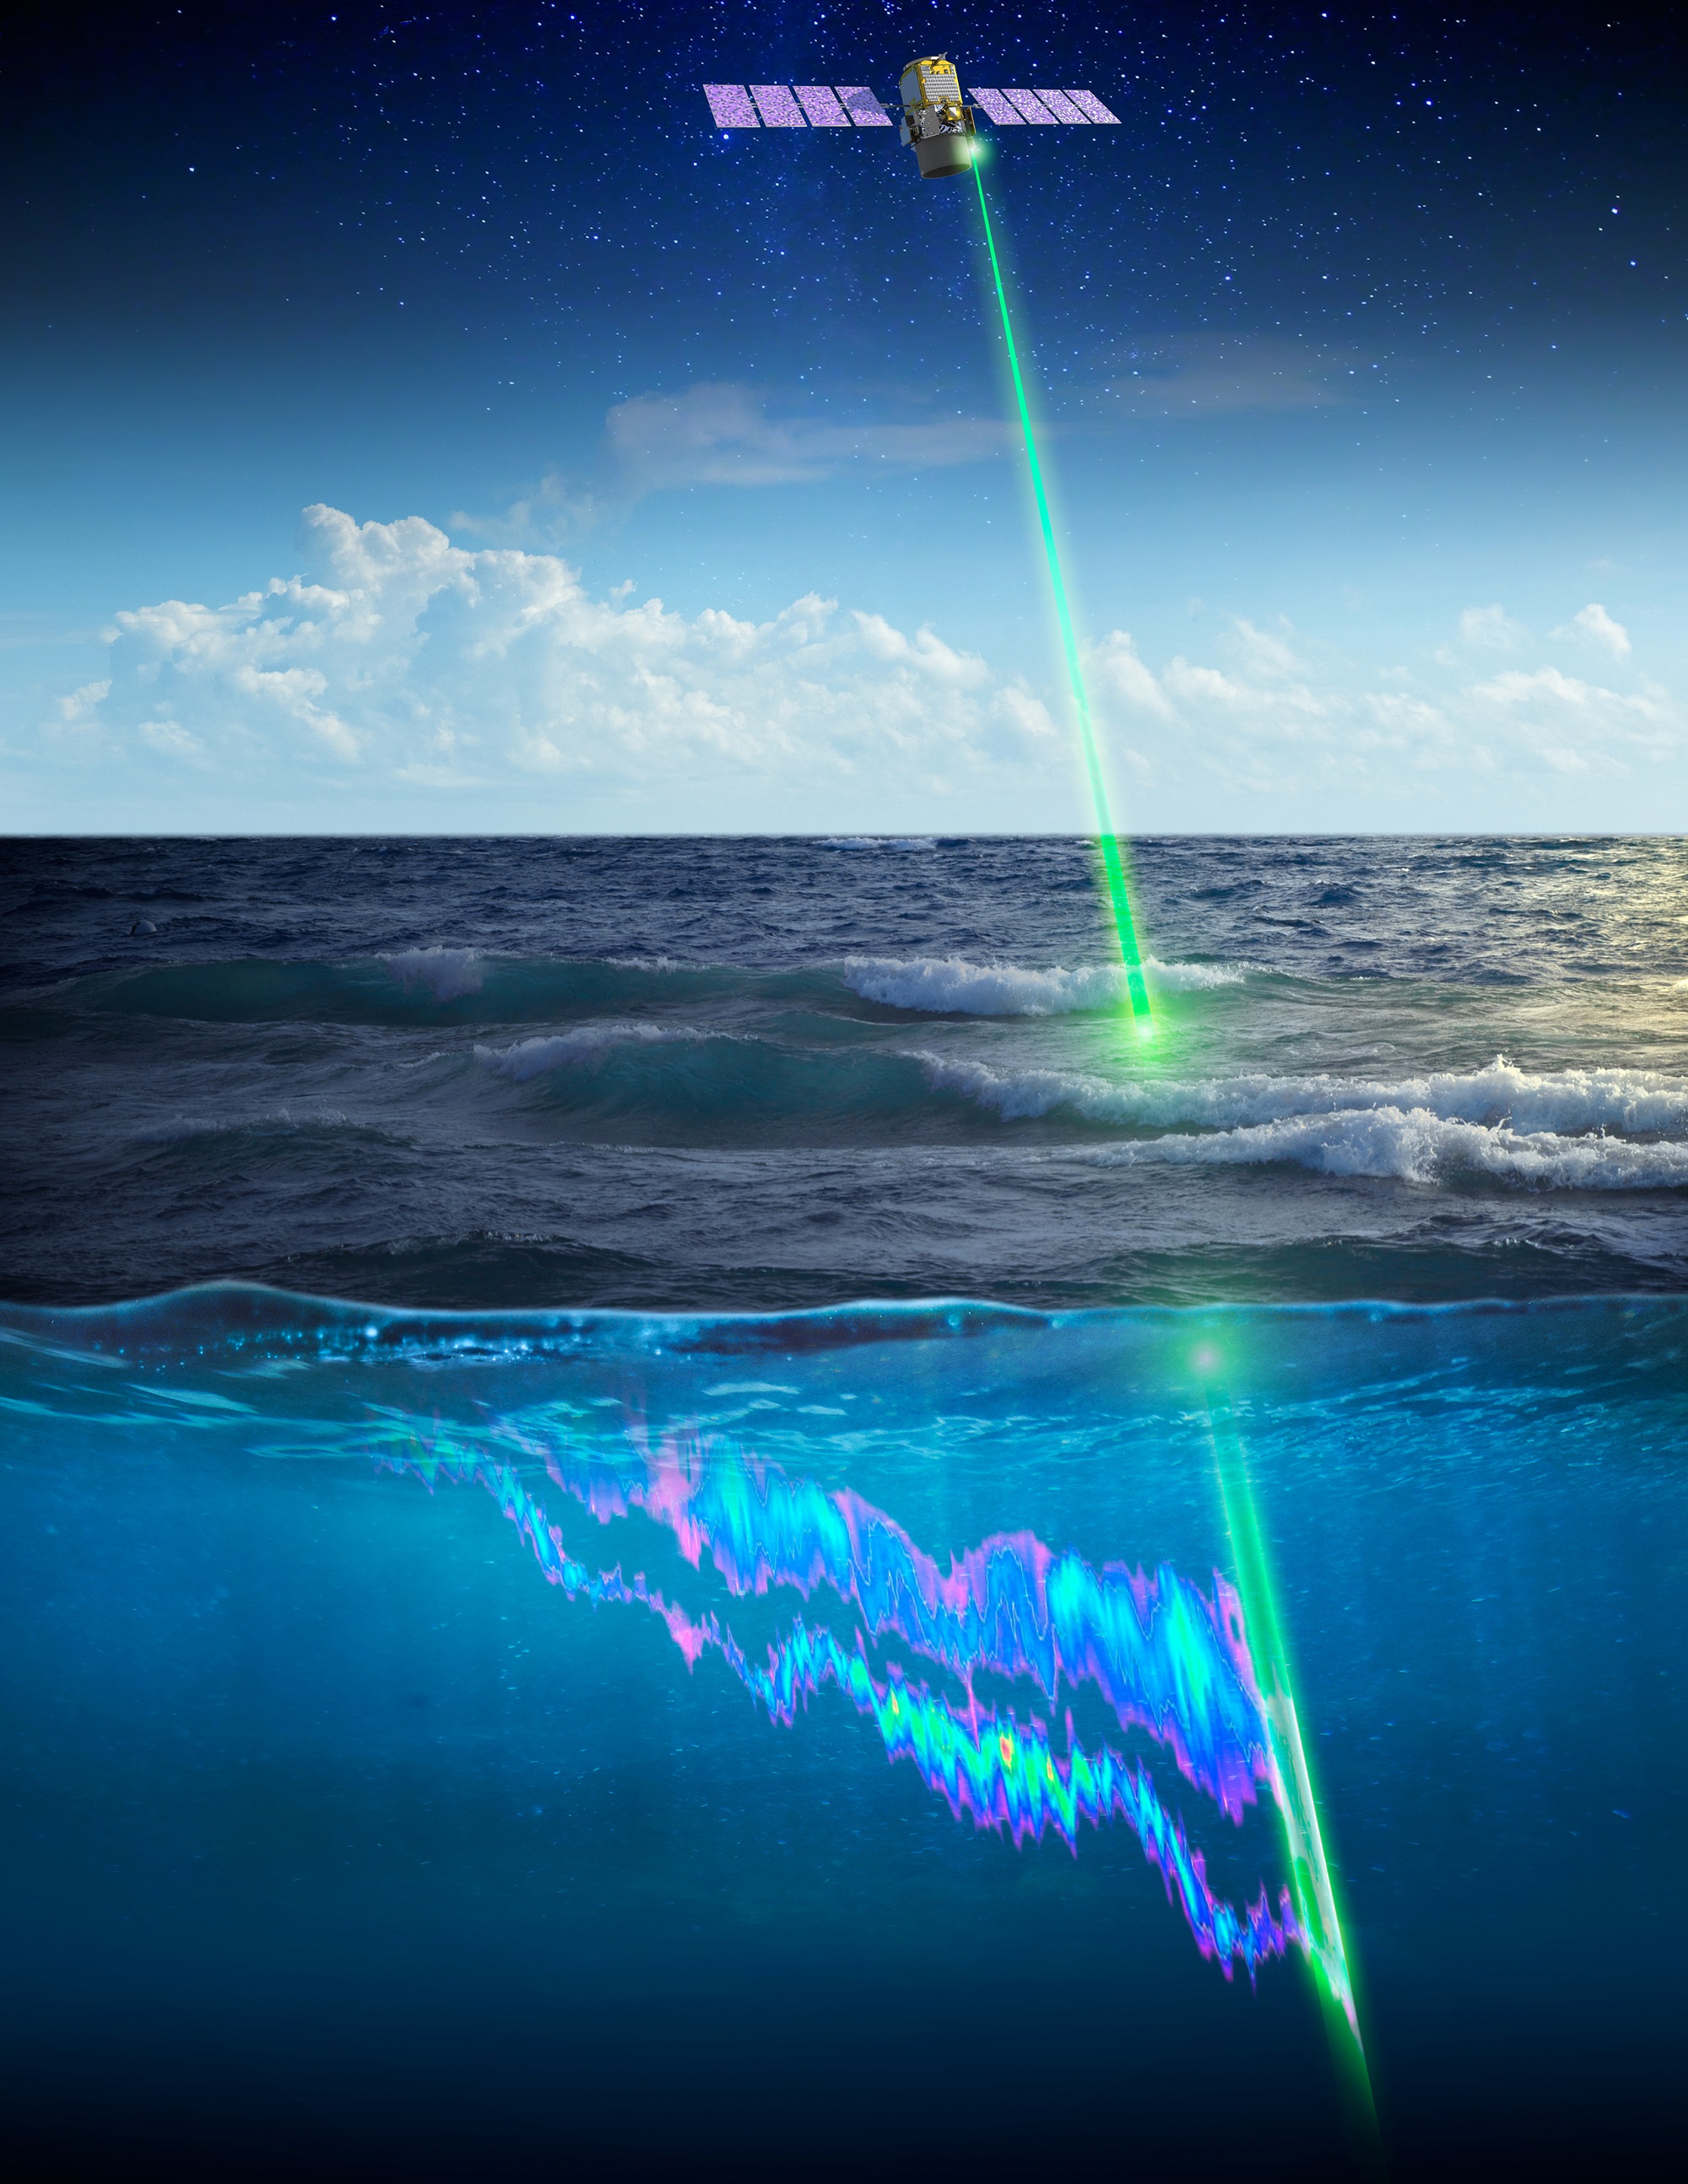
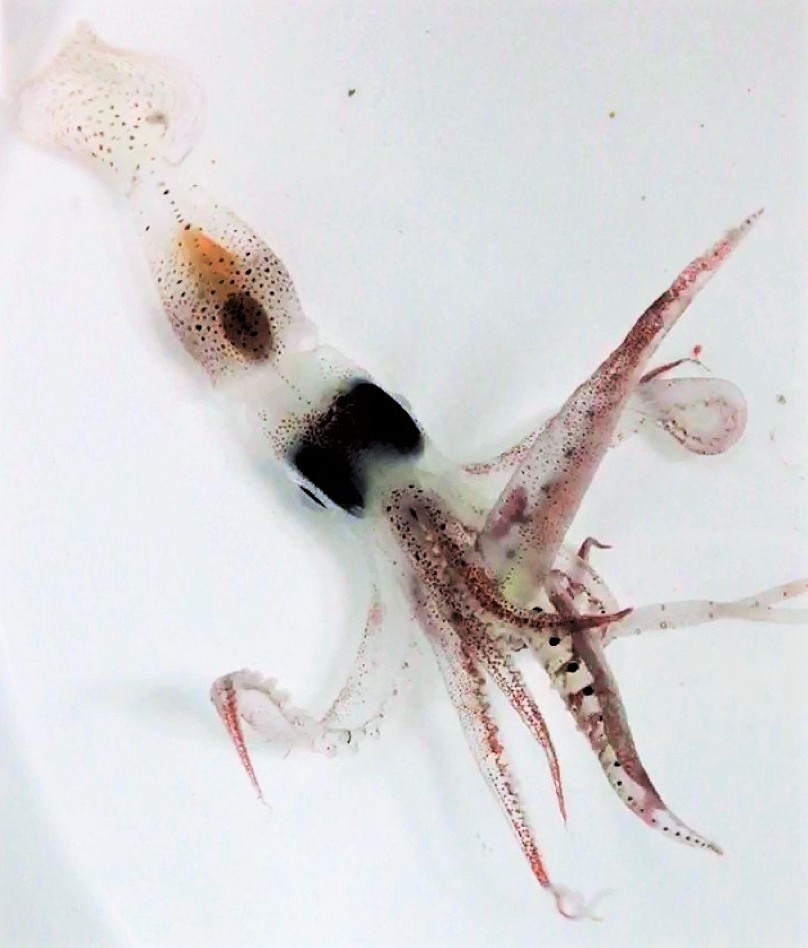
Tiny creatures such as small squid, fish and krill are part of the massive vertical migration pattern in the ocean that has now been measured around the world from space. Credits: Chandler Countryman
Every night, under the cover of darkness, countless small sea creatures – from squid to krill – swim from the ocean depths to near the surface to feed. This vast animal migration – the largest on the planet and a critical part of Earth’s climate system – has been observed globally for the first time thanks to an unexpected use of a space-based laser.
Researchers observed this vertical migration pattern using the Cloud-Aerosol Lidar and Infrared Pathfinder Satellite Observations (CALIPSO) satellite — a joint venture between NASA and the French space agency, Centre National d’Etudes Spatiales — that launched in 2006. They published their findings in the journal Nature Wednesday.
“This is the latest study to demonstrate something that came as a surprise to many: that lidars have the sensitivity to provide scientifically useful ocean measurements from space,” said Chris Hostetler, a scientist at NASA’s Langley Research Center in Hampton, Virginia, and co-author on the study. “I think we are just scratching the surface of exciting new ocean science that can be accomplished with lidar.”
The study looks at a phenomenon known as Diel Vertical Migration (DVM), in which small sea creatures swim up from the deep ocean at night to feed on phytoplankton near the surface, then return to the depths just before sunrise. Scientists recognize this natural daily movement around the world as the largest migration of animals on Earth in terms of total number.
The cumulative effect of daily vertically migrating creatures on Earth’s climate is significant. During the day, ocean phytoplankton photosynthesize and, in the process, absorb significant amounts of carbon dioxide, which contributes to the ocean’s ability to absorb the greenhouse gas from the atmosphere. Animals that undergo DVM come up to the surface to feed on phytoplankton near the ocean’s surface and then swim back down, taking the phytoplankton carbon with them. Much of this carbon is then defecated at depths where it is effectively trapped deep in the ocean, preventing its release back into the atmosphere.
“What the lidar from space allowed us to do is sample these migrating animals on a global scale every 16 days for 10 years,” said Mike Behrenfeld, the lead for the study and a senior research scientist and professor at Oregon State University in Corvallis, Oregon. “We’ve never had anywhere near that kind of global coverage to allow us to look at the behavior, distribution and abundance of these animals.”
Zeroing in on tropical and subtropical ocean regions, researchers found that while there are fewer vertically migrating animals in lower-nutrient and clearer waters, they comprise a greater fraction of the total animal population in these regions. This is because the migration is a behavior that has evolved primarily to avoid visual predators during the day when visual predators have their greatest advantage in clear ocean regions.
In murkier and more nutrient-rich regions, the abundance of animals that undergo DMV is higher, but they represent a smaller fraction of the total animal population because visual predators are at a disadvantage. In these regions, many animals just stay near the surface both day and night.
The researchers also observed long-term changes in populations of migrating animals, likely driven by climate variations. During the study period (2008 to 2017), CALIPSO data revealed an increase in migrating animal biomass in the subtropical waters of the North and South Pacific, North Atlantic and South Indian oceans. In the tropical regions and North Atlantic, biomass decreased. In all but the tropical Atlantic regions, these changes correlated with changes in phytoplankton production.
This animal-mediated carbon conveyor belt is recognized as an important mechanism in Earth’s carbon cycle. Scientists are adding animals that undergo DVM as a key element in climate models.
“What these modelers haven’t had is a global dataset to calibrate these models with, to tell them where these migrators are most important, where they’re most abundant, and how they change over time,” said Behrenfeld. “The new satellite data give us an opportunity to combine satellite observations with the models and do a better job quantifying the impact of this enormous animal migration on Earth’s carbon cycle.”
The satellite data are also relevant to global fisheries because the migrating animals are an important food source for larger predators that lurk in the depths of the ocean. Those predators are often species of fish that are attractive to commercial fisheries. The larger the DVM signal, the larger the population of fish that can live in the deep sea.
Though CALIPSO’s laser was designed to measure clouds and atmospheric aerosols, it can penetrate the upper 20 meters of the ocean’s surface layer. If the migrating animals reach this layer, they are detected by CALIPSO.
NASA uses the vantage point of space to understand and explore our home planet, improve lives and safeguard our future. The agency’s observations of Earth’s complex natural environment are critical to understanding how our planet’s natural resources and climate are changing now and could change in the future.
For more information about NASA’s Earth science activities, visit:
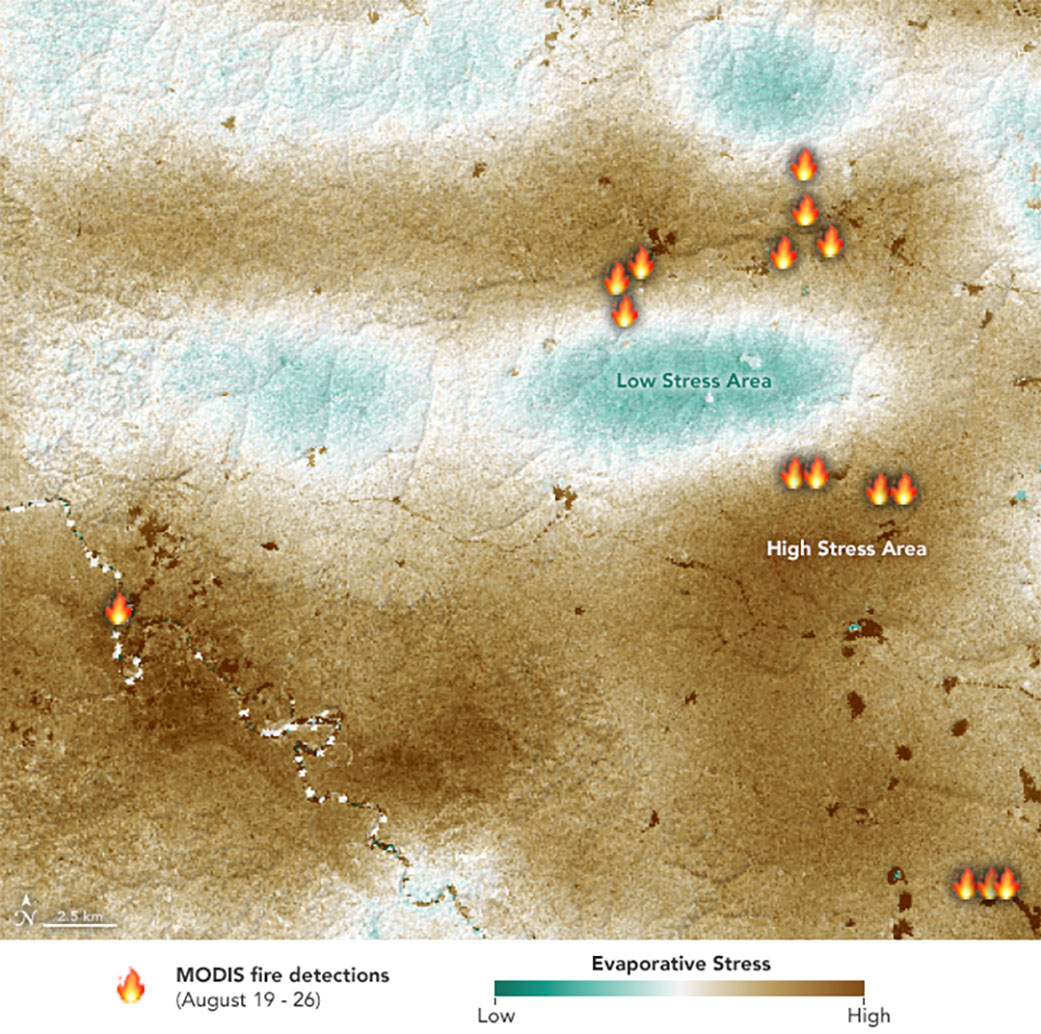
NASA’s ECOSTRESS sensor measured the stress levels of plants when it passed over the Peruvian Amazon rainforest on Aug. 7, 2019. The map reveals that the fires were concentrated in areas of water-stressed plants (brown). The pattern points to how plant health can impact the spread of fires. Credits: NASA/JPL-Caltech/Earth Observatory
A new satellite-based map of a section of the Amazon Basin reveals that at least some of the massive fires burning there this past summer were concentrated in water-stressed areas of the rainforest. The stressed plants released measurably less water vapor into the air than unstressed plants; in other words, they were struggling to stay cool and conserve water, leaving them more vulnerable to the fires.
The fires in the Amazon Basin, which continue to burn into November, are mainly the result of such human activities as land clearing and deforestation. The pattern — spotted from space by NASA’s ECOsystem Spaceborne Thermal Radiometer Experiment on Space Station (ECOSTRESS) — points to how water-stressed plants can impact the spread of fires. The data may one day help NASA’s Earth-observing missions predict the path of future forest or brush fires like those currently raging in California.
The primary mission of ECOSTRESS, an instrument that measures thermal infrared energy emitted from the land surface, is to provide insight into plants’ health by taking their temperature. To keep cool, plants “sweat” by releasing water vapor through their pores, a process called evapotranspiration. After multiple orbits, ECOSTRESS is able to measure how much plants transpire and track their response to climate change.
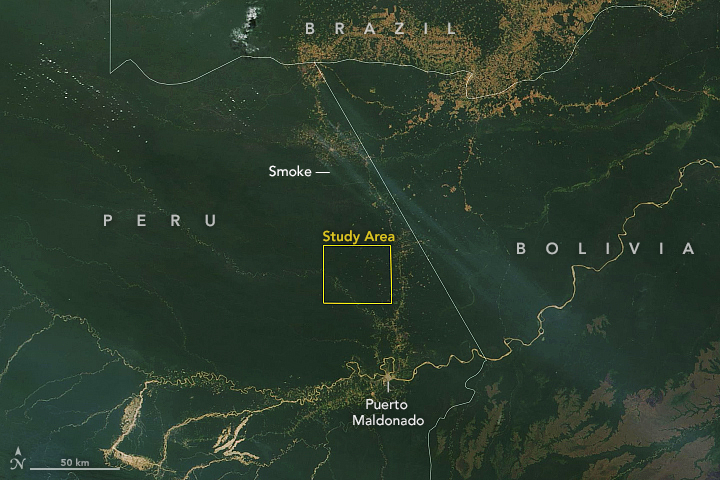
In August, fires spread over large swaths of the Amazon Basin. ECOSTRESS captured the first image of the Amazon rainforest in Peru before the fires began, on Aug. 7. It shows a surface temperature map revealing water-stressed and non-stressed forest (shown in brown and blue, respectively). The fire icons represent fires imaged by NASA’s Terra satellite between Aug. 19 and 26. The fires are limited primarily to areas of water-stressed plants that transpired the least. The second image, taken by the Terra satellite on Aug. 18, shows the ECOSTRESS study area and smoke from active fires in the rainforest.
This satellite image, taken by NASA’s Earth-observing Terra satellite on Aug. 18, 2019, shows the ECOSTRESS study area in the Amazon Basin and smoke from active fires in the rainforest. Credits: NASA/JPL-Caltech/Earth Observatory
The image also reveals how certain parts of the forest were more resilient, seeming to protect themselves from burning. Plants in these areas were cooler — in other words, they released more water vapor from their leaves — than plants in the burn zones, though mission scientists don’t know whether that’s a coincidence or a direct causal relationship. The water-stressed areas of the forest look as green and healthy as these cooler areas, making them invisible except to a radiometer that can measure thermal infrared energy from the surface.
“To the naked eye, the fires appear randomly distributed throughout the forest,” said Josh Fisher, ECOSTRESS science lead at NASA’s Jet Propulsion Laboratory in Pasadena, California. “But, if you overlay the ECOSTRESS data, you can see that the fires are mainly confined within the highly water-stressed areas. The fires avoided the low-stress areas where the forest appears to have access to more water.”
It’s still a mystery why some plants become stressed while other plants don’t, though scientists believe it’s dependent on factors like the species of plant or amount of water in the soil. The data from ECOSTRESS will help answer questions about which plants will thrive in their changing environments and could also be used to help with decisions related to water management and agricultural irrigation.
JPL built and manages the ECOSTRESS mission for the Earth Science Division in the Science Mission Directorate at NASA Headquarters in Washington. ECOSTRESS is an Earth Venture Instrument mission; this program is managed by NASA’s Earth System Science Pathfinder program at NASA’s Langley Research Center in Hampton, Virginia.
More information about ECOSTRESS is available here:
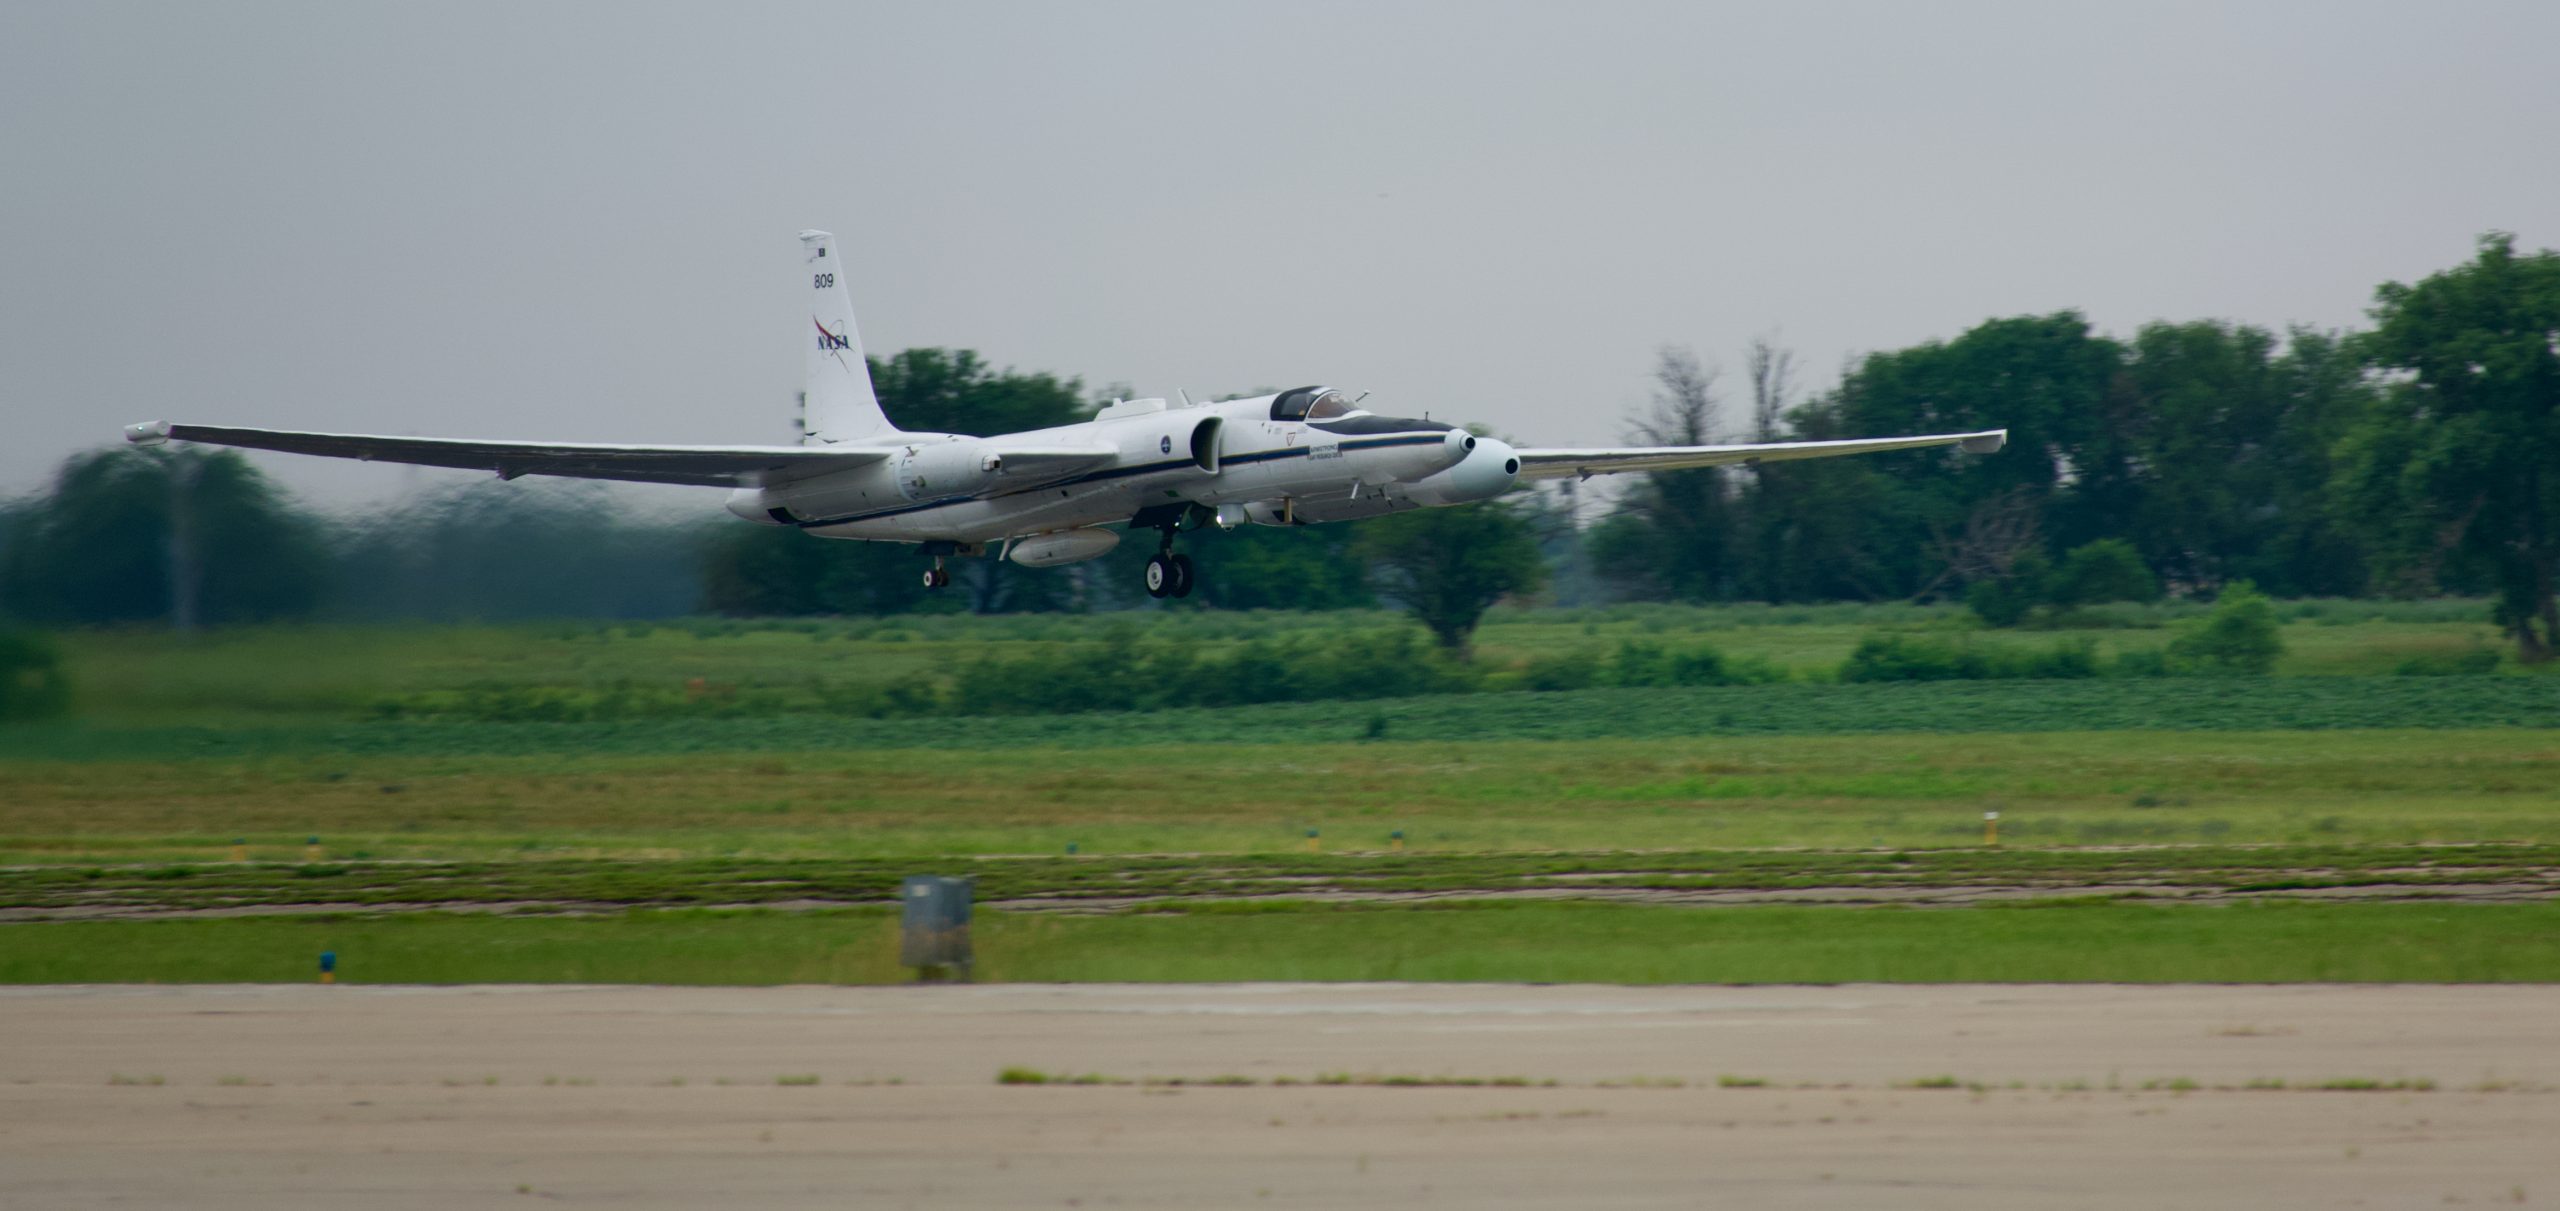 ER-2 takeoff on 16 July 2021 for DCOTSS Research Flight 01. Photo credit: Dan Chirica
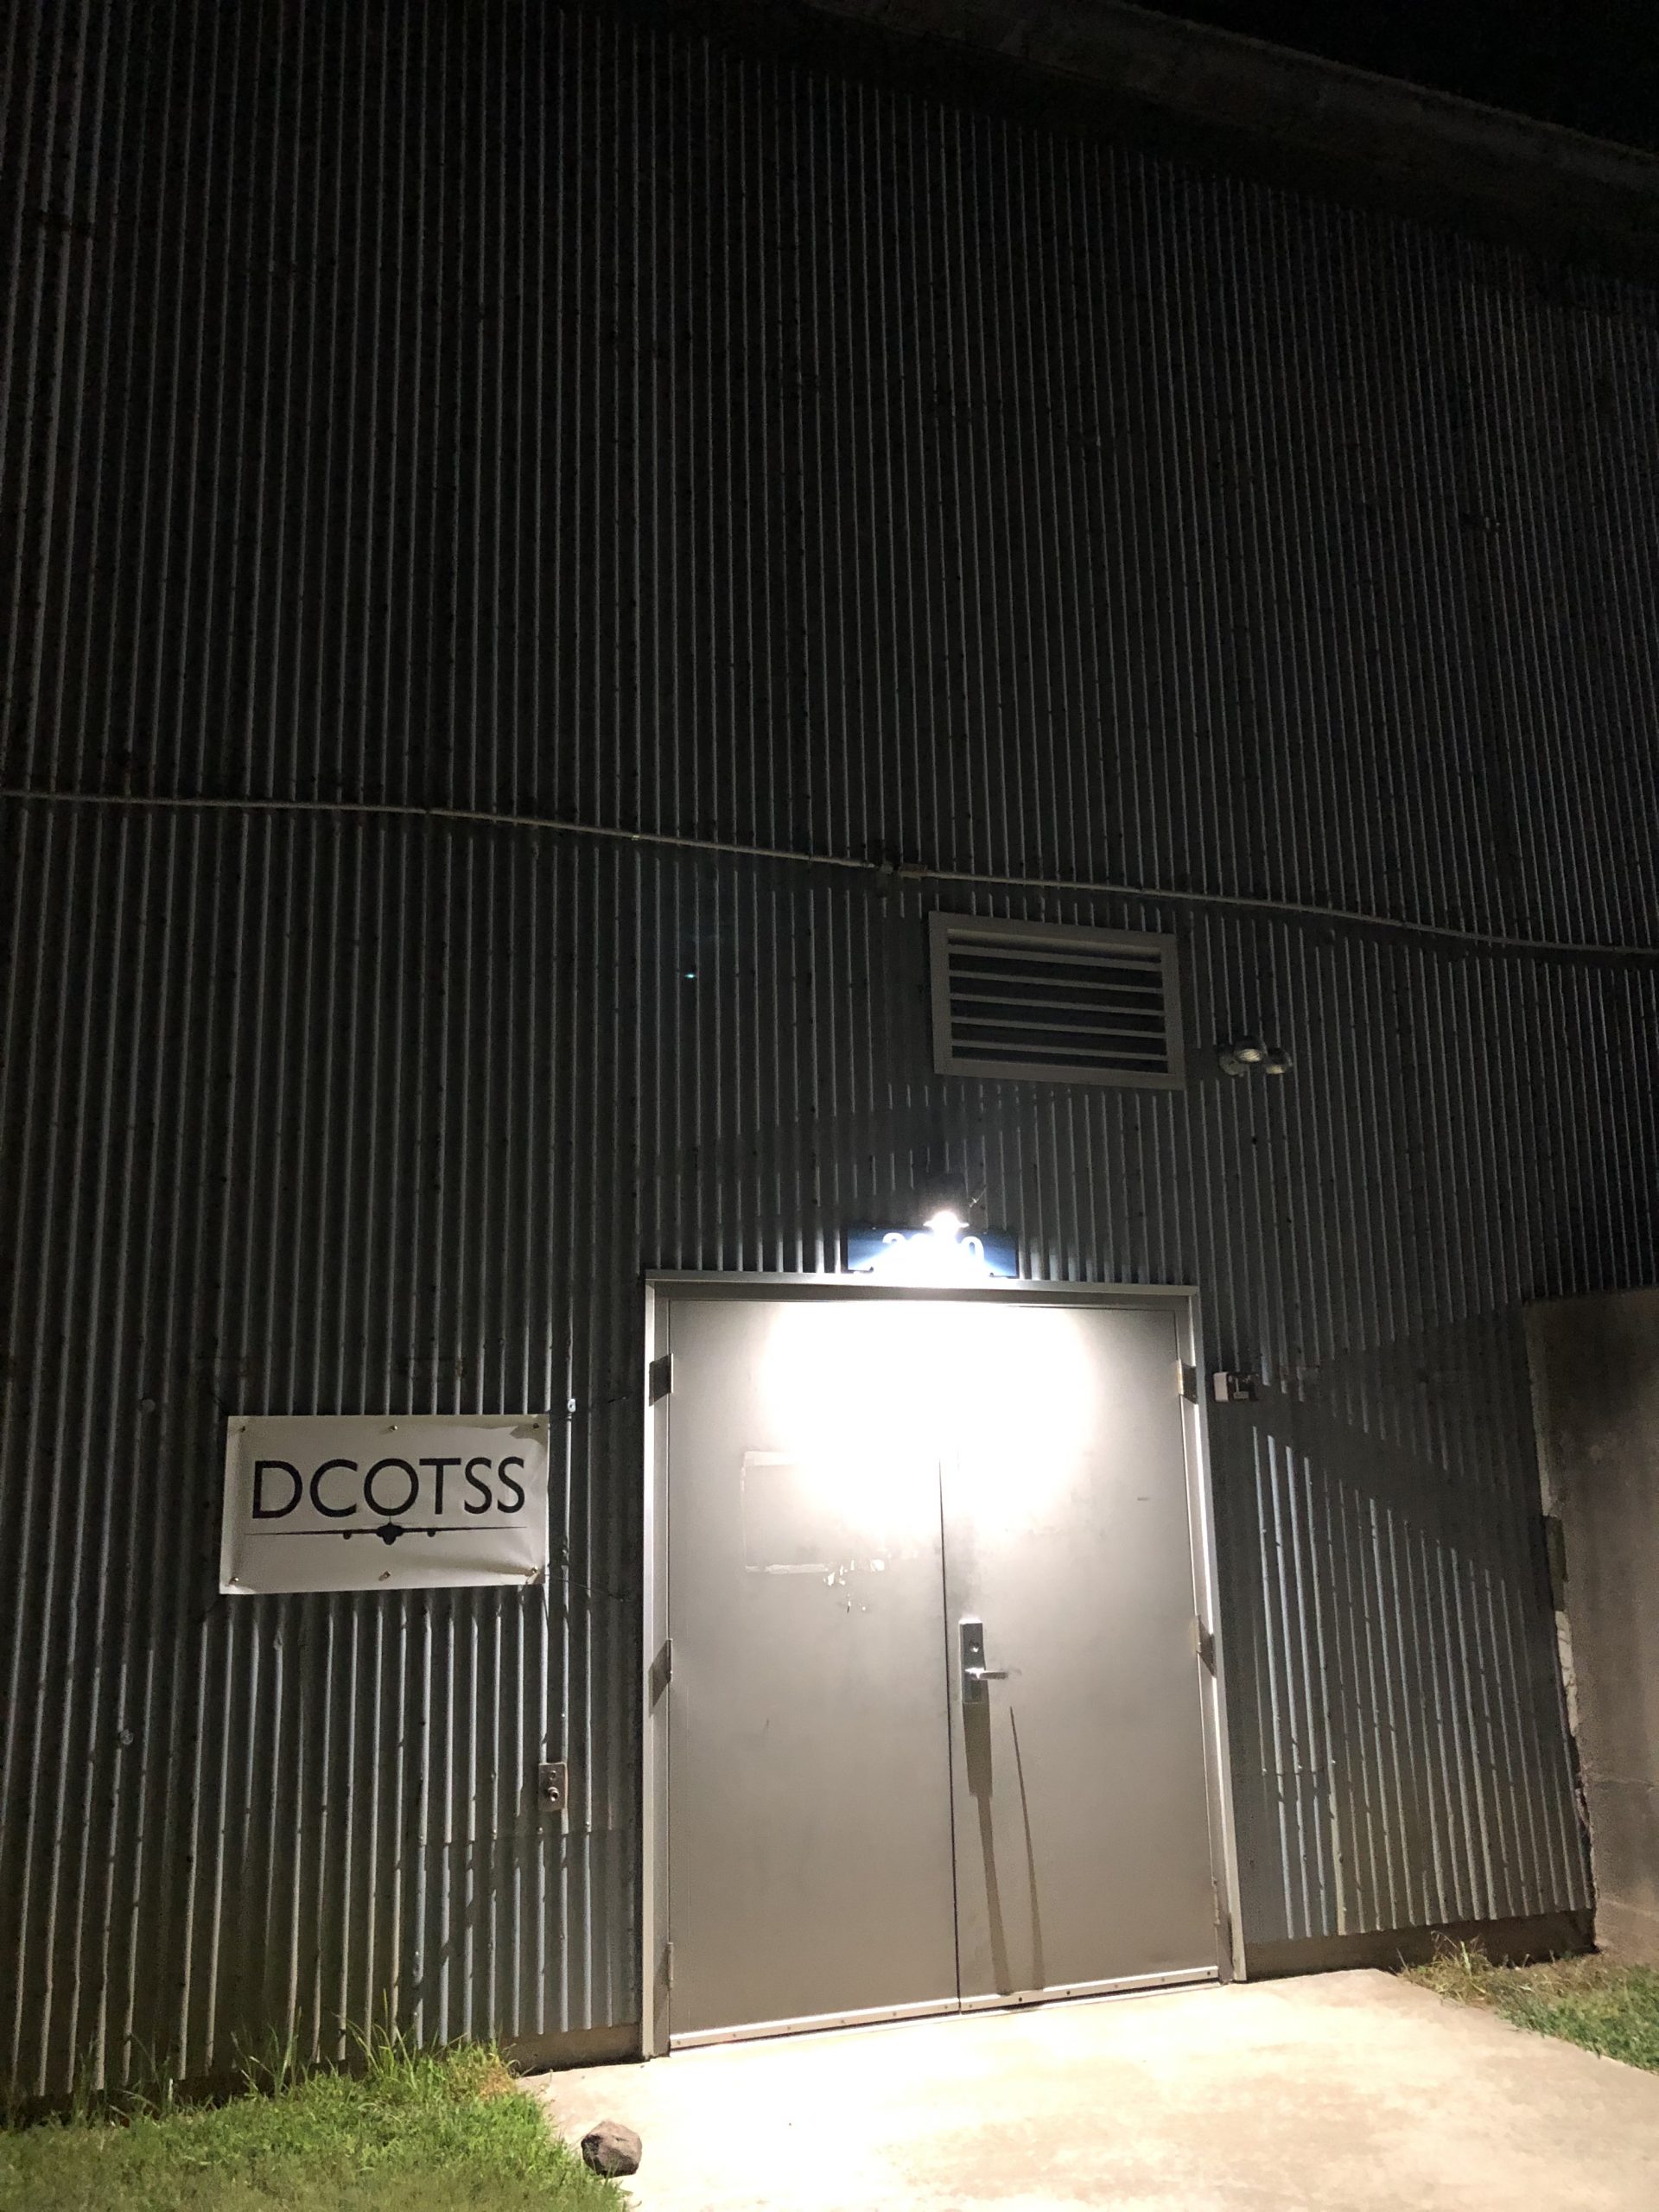 A picture of the door to the hangar taken by me (Rei Ueyama) on the morning of DCOTSS Research Flight 04 on 26 July 2021.
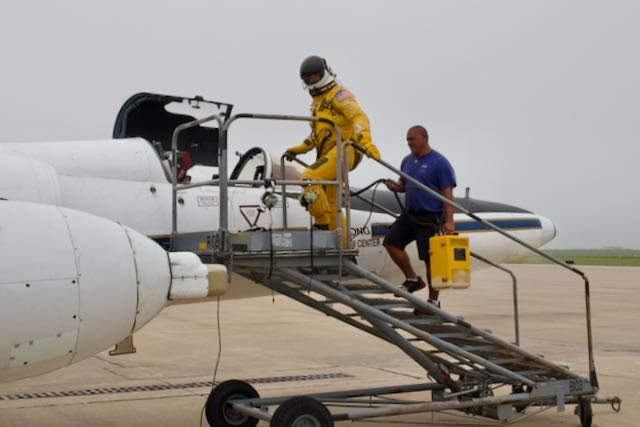 ER-2 pilot (Greg “Coach” Nelson) stepping into the aircraft for DCOTSS Research Flight 01 on 16 July 2021. Photo credit: Dan Chirica
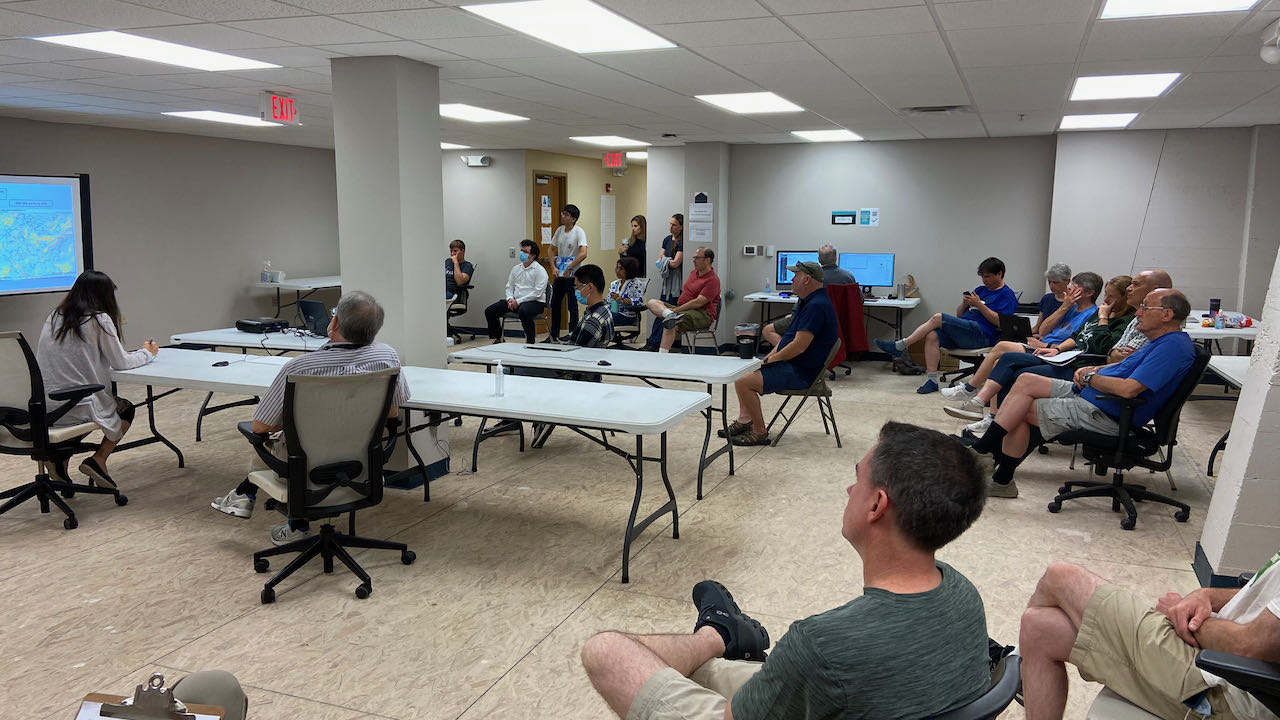 A picture of forecasting and flight planning meeting on the morning of 15 July 2021. I am sitting in the front left corner (my back facing the camera), leading the meeting. Photo credit: Dan Chirica
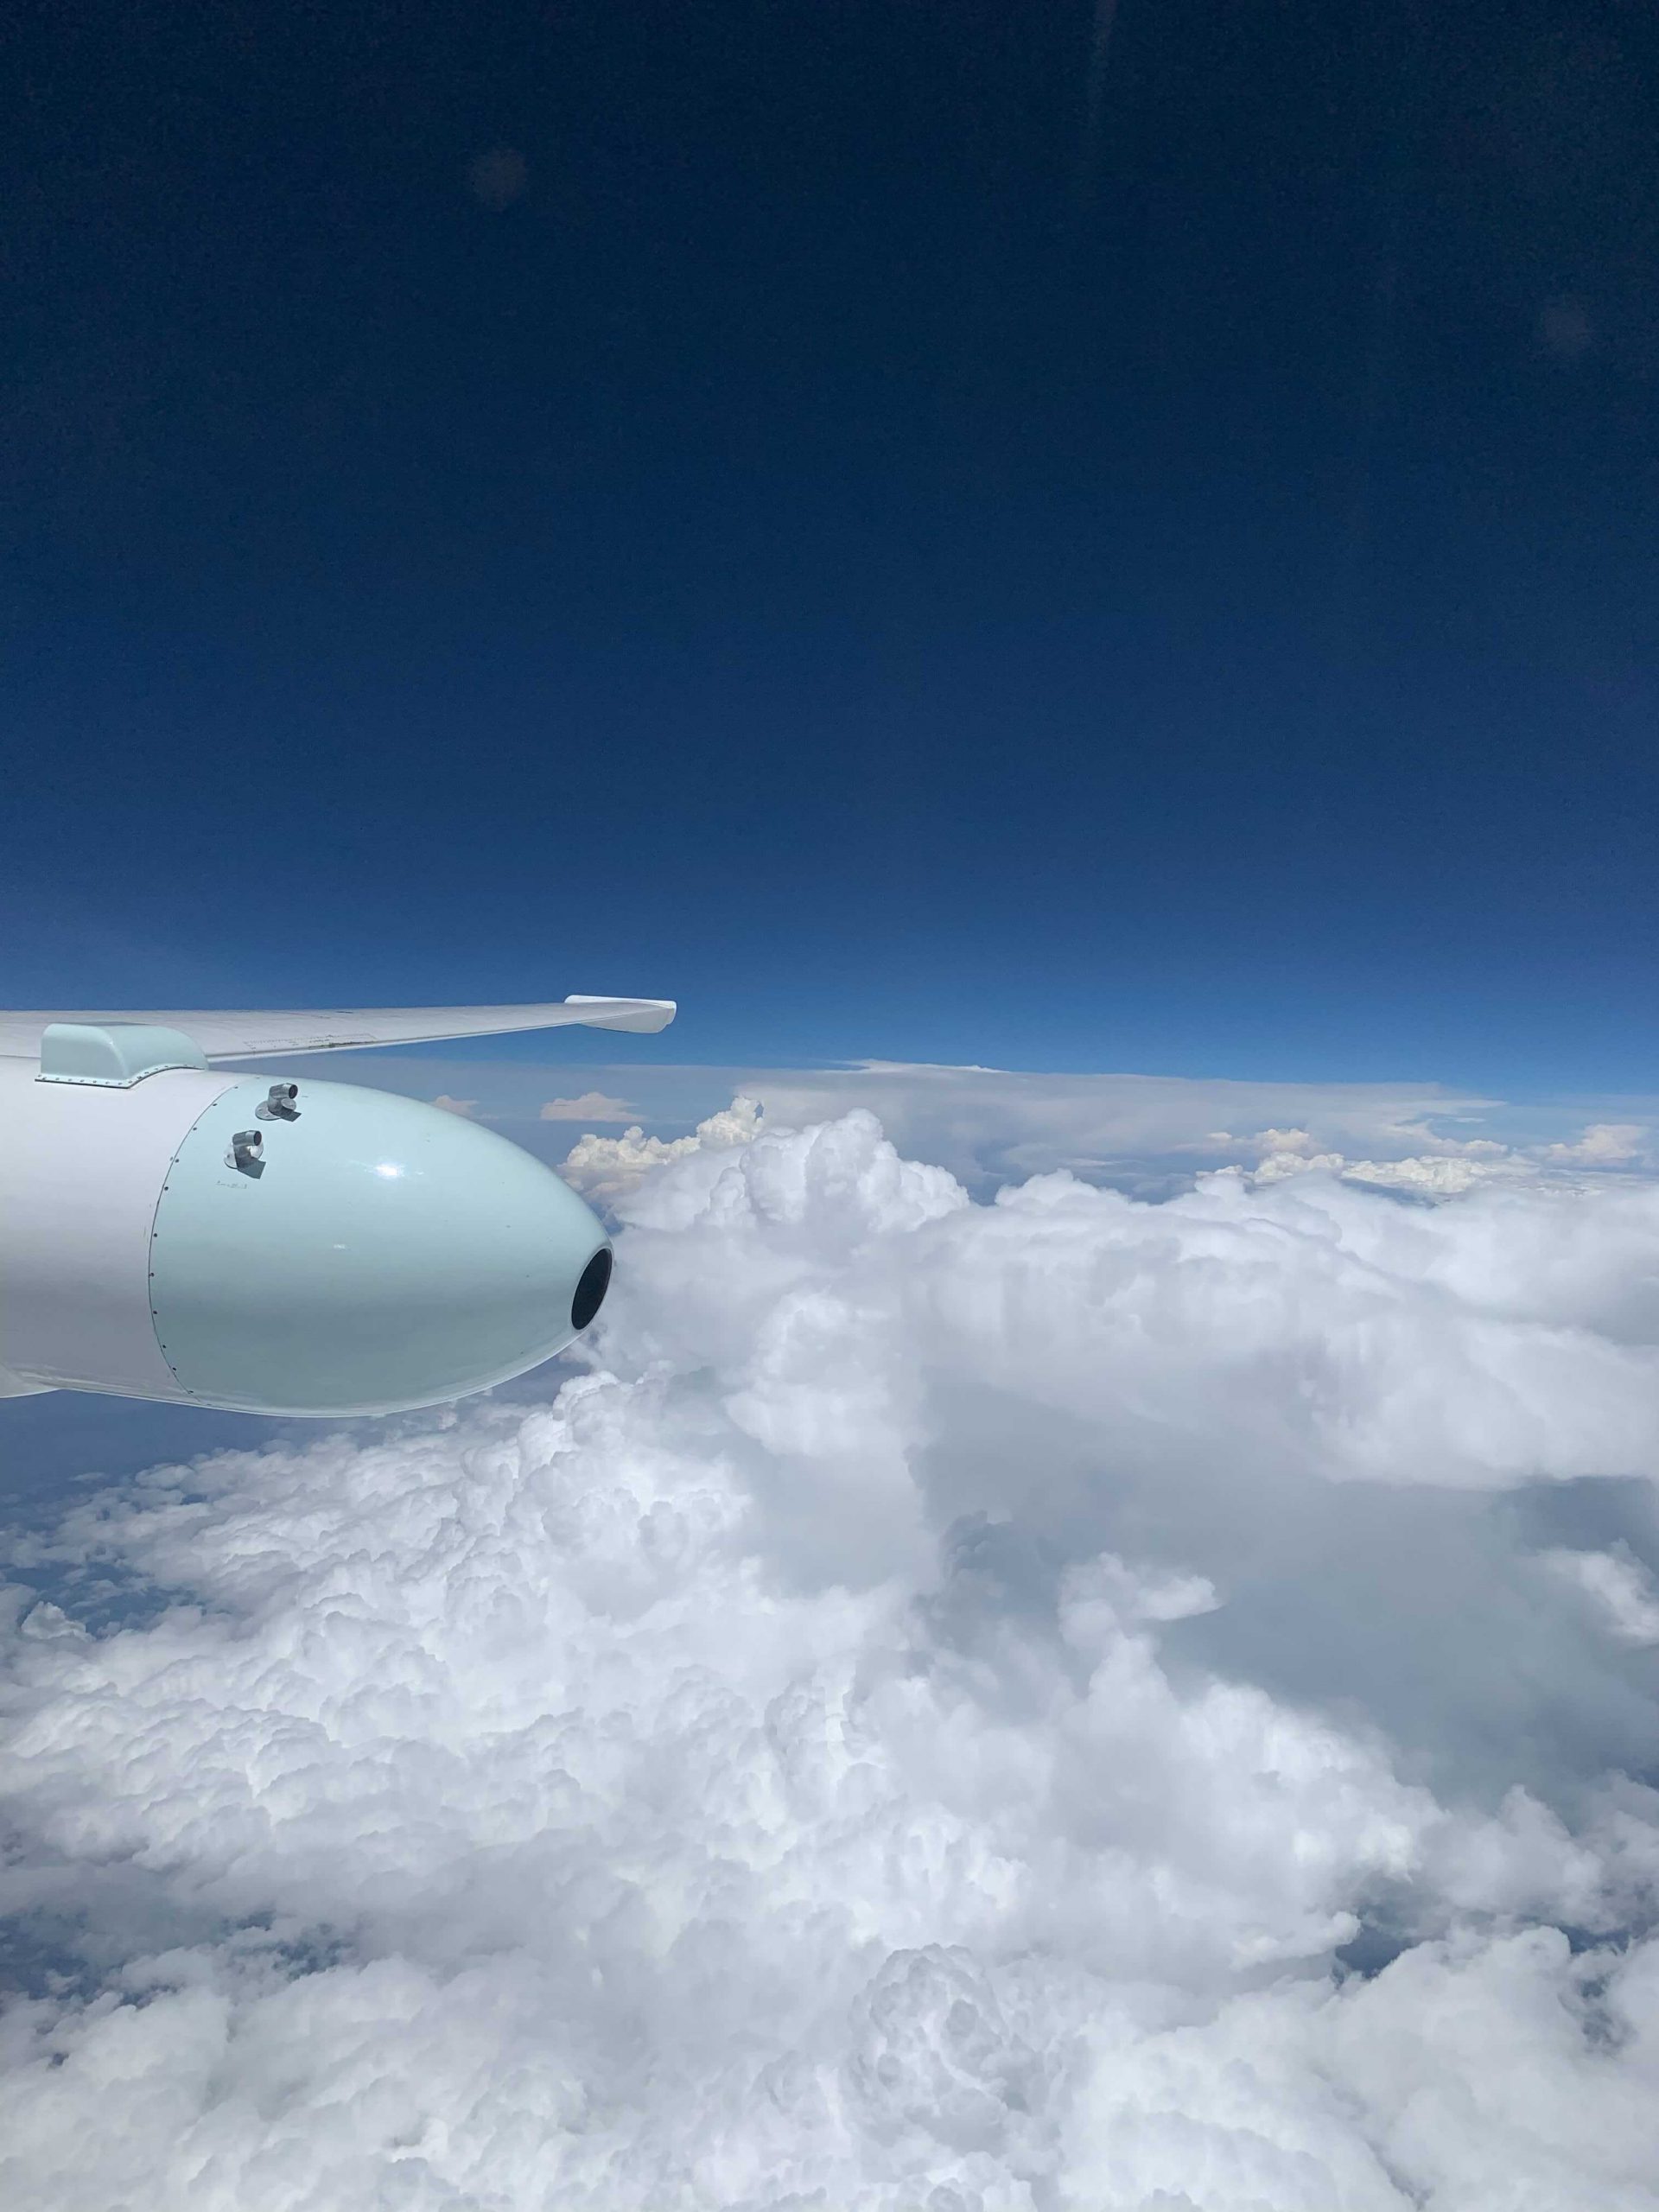 A picture of non-overshooting convective storms reaching up to 45 kft taken by the pilot (Gary “Thor” Toroni) on DCOTSS Research Flight 02 on 20 July 2021. Photo credit: Gary “Thor” Toroni