NASA researchers are using high resolution airborne data to determine the vulnerability and resilience of the Mississippi River Delta.
Cynthia Hall, NASA ESDS Program Community Coordinator
Many of the world’s large deltas are in peril due to coastal land subsidence and sea level rise. The Mississippi River Delta is one of these disappearing systems; it’s the world’s seventh largest delta and is a living laboratory where scientists can gather data to learn how to save these valuable ecosystems and the services they provide.
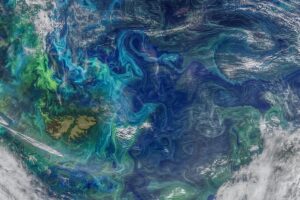
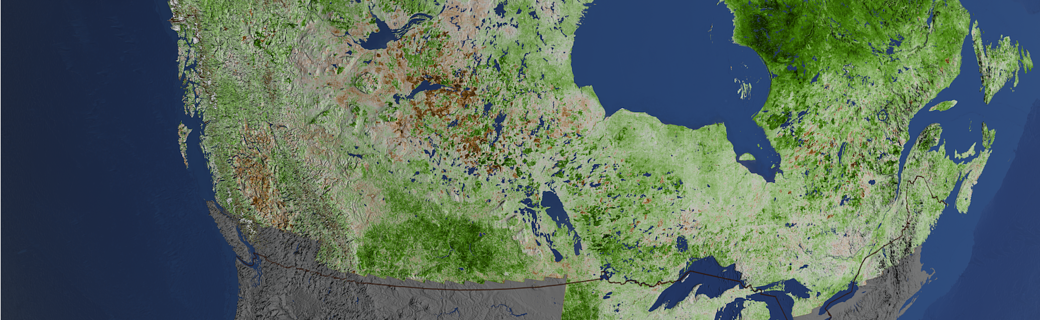
This series of false-color satellite images chronicles the growth of the Wax Lake Outlet Delta (upper feature) and the Atchafalaya River Delta (lower feature) in Louisiana between 1984 and 2017 where they empty into the Gulf of Mexico. All of the images were acquired by instruments aboard the joint NASA/USGS Landsat series of satellites. Credit: NASA Earth Observatory.
On average there is one delta for every 300 km of shoreline around the world. As rivers meet the ocean, slowing down and fanning out, sediments are dropped, forming a delta. Coastal waves, river discharge, vegetation, and tidal water flow all influence the development of deltas. Coastal communities rely on deltaic environments for many reasons and their disappearance can have catastrophic effects. Deltas serve as a buffer for storm surges, thereby protecting mainland areas; they serve as nurseries for a variety of marine organisms; they sustain and provide sustenance for biologically diverse ecosystems; and their soil serves as a filter that removes toxins from the water. The loss of a delta to subsidence and sea level rise would result in numerous environmental, economic, and social impacts on coastal communities.
The Mississippi River Delta is a unique testbed in that it is sinking in some areas, like the Terrebonne Basin, but growing in adjacent areas, like the Atchafalaya Basin to the west. The Terrebonne Basin is engineered (marked by channelization and levees), and this has decreased sediment flow to the delta floodplain. Large parts of the Atchafalaya Basin, conversely, allow rivers to deliver sediment to that basin. According to Delta-X principal investigator (PI) Dr. Marc Simard and co-PI Dr. Cathleen Jones at NASA’s Jet Propulsion Laboratory in Pasadena, CA, the Mississippi River Delta offers the unique opportunity to investigate areas with similar vegetation and climate, but very different soil accretion patterns. Understanding delta formation in an environment like the Mississippi River Delta, that is experiencing both erosion and accretion, is important because the U.S. Gulf Coast is experiencing some of the highest levels of global sea level rise: between 9 to 12 mm per year, which is three-to-four times the global average.
The Investigation
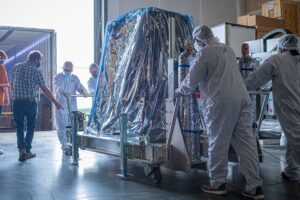
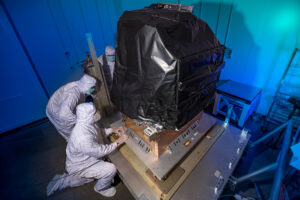
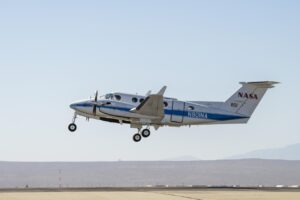
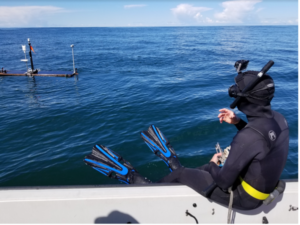
NASA’s Delta-X airborne mission, with flights that began on March 26, 2021, is gathering remotely sensed and in situ data to study changes occurring to the water, vegetation, and sediment along the Atchafalaya and Terrebonne Basins. The data will be assimilated into a model to forecast the resilience and vulnerability of the delta given the rising seas; the framework for the model can be used for forecasting change in other delta systems around the world. Delta-X was competitively selected through NASA’s Earth Venture Suborbital-3 program.
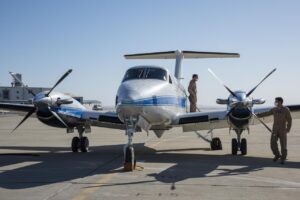
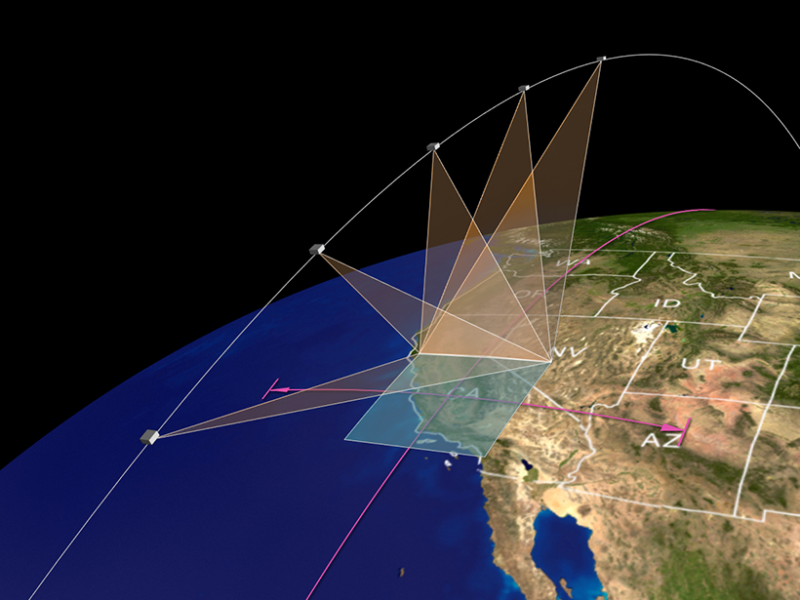
Delta-X uses three primary airborne sensors: the Airborne Visible-Infrared Imaging Spectrometer-Next Generation (AVIRIS-NG), an instrument with high spectral resolution at visible wavelengths; the Air Surface Water and Ocean Topography (AirSWOT) instrument suite, which includes a Ka-band synthetic aperture radar (SAR); and the Uninhabited Aerial Vehicle Synthetic Aperture Radar (UAVSAR), which collects data in the L-band. Wavelength is an important feature to consider when working with SAR since the wavelength determines how the radar signal interacts with the surface and how far the signal penetrates into a medium. The Ka-band represents a shorter wavelength and is able to measure highly reflective rough water surfaces with little to no vegetation, whereas the longer wavelength L-band can penetrate more heavily vegetated areas to measure changes in the water surface below vegetation.
For more information on sensors and spectral resolution, see the Earthdata Backgrounders What is Remote Sensing and What is Synthetic Aperture Radar.
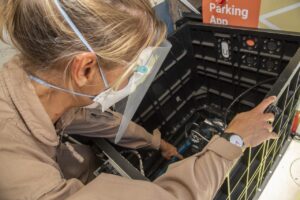
These airborne instruments collect data more frequently than satellites in order to detect changes to water levels and sediment concentration over a full tidal cycle (the Gulf Coast experiences diurnal tides, meaning one high and one low tide per day). The data will be collected concurrently on three different aircraft, while scientists in the field collect in situ data at the same time. This facilitates multi-scale and multi-instrument calibration of models. These models will be used to validate upcoming satellite missions like the Surface Water and Ocean Topography (SWOT) and the NASA/Indian Space Research Organization (ISRO) Synthetic Aperture Radar (NISAR) missions. These missions will not have the ability to make multiple measurements during a single tidal cycle, however. SWOT will obtain measurements over a given area every 21 days and NISAR every 12 days.
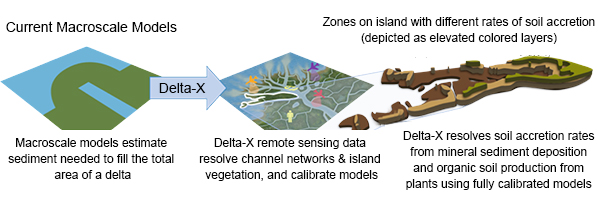
Delta-X makes breakthrough advances in the study of deltaic evolution, moving beyond coarse areal averaging to resolve mesoscale features. Click on image for larger view. Credit: NASA’s Jet Propulsion Laboratory.
The data from Delta-X will be used to calibrate and validate a series of dynamic, hydroecological models, which can then be used to forecast the future of the Mississippi River Delta. Delta formation models before AirSWOT were developed at a coarse scale. Delta-X co-PI Jones equates this to a bathtub view, in which you are looking at the entire deltaic system (macroscale). To more accurately predict the resilience of the delta and inform realistic remediation plans, measurements at a smaller, or mesoscale (around one hectare [10,000 m2] or roughly the size of a sports field), are needed. To make better predictions about delta formation, scientists need to be able to define channels, surface water levels and discharge, sediment movement, and plant production at a much finer resolution than coarse areal averages.
The UAVSAR data will create maps of water level changes in wetlands over time; AirSWOT data will provide water surface elevation measurements over the same time period, but within channels and lakes. These measurements help with understanding river discharge and sediment transport across the floodplain’s wetlands. There are two processes which contribute to soil accretion: delivery of sediments and plant production of organic material (i.e. roots and litter). AVIRIS-NG will be used to estimate the quantity of sediment being transported in the rivers and also to estimate plant structure, including species, biomass, and spatial distribution. This information will be incorporated into a model that simulates how the delta evolves.
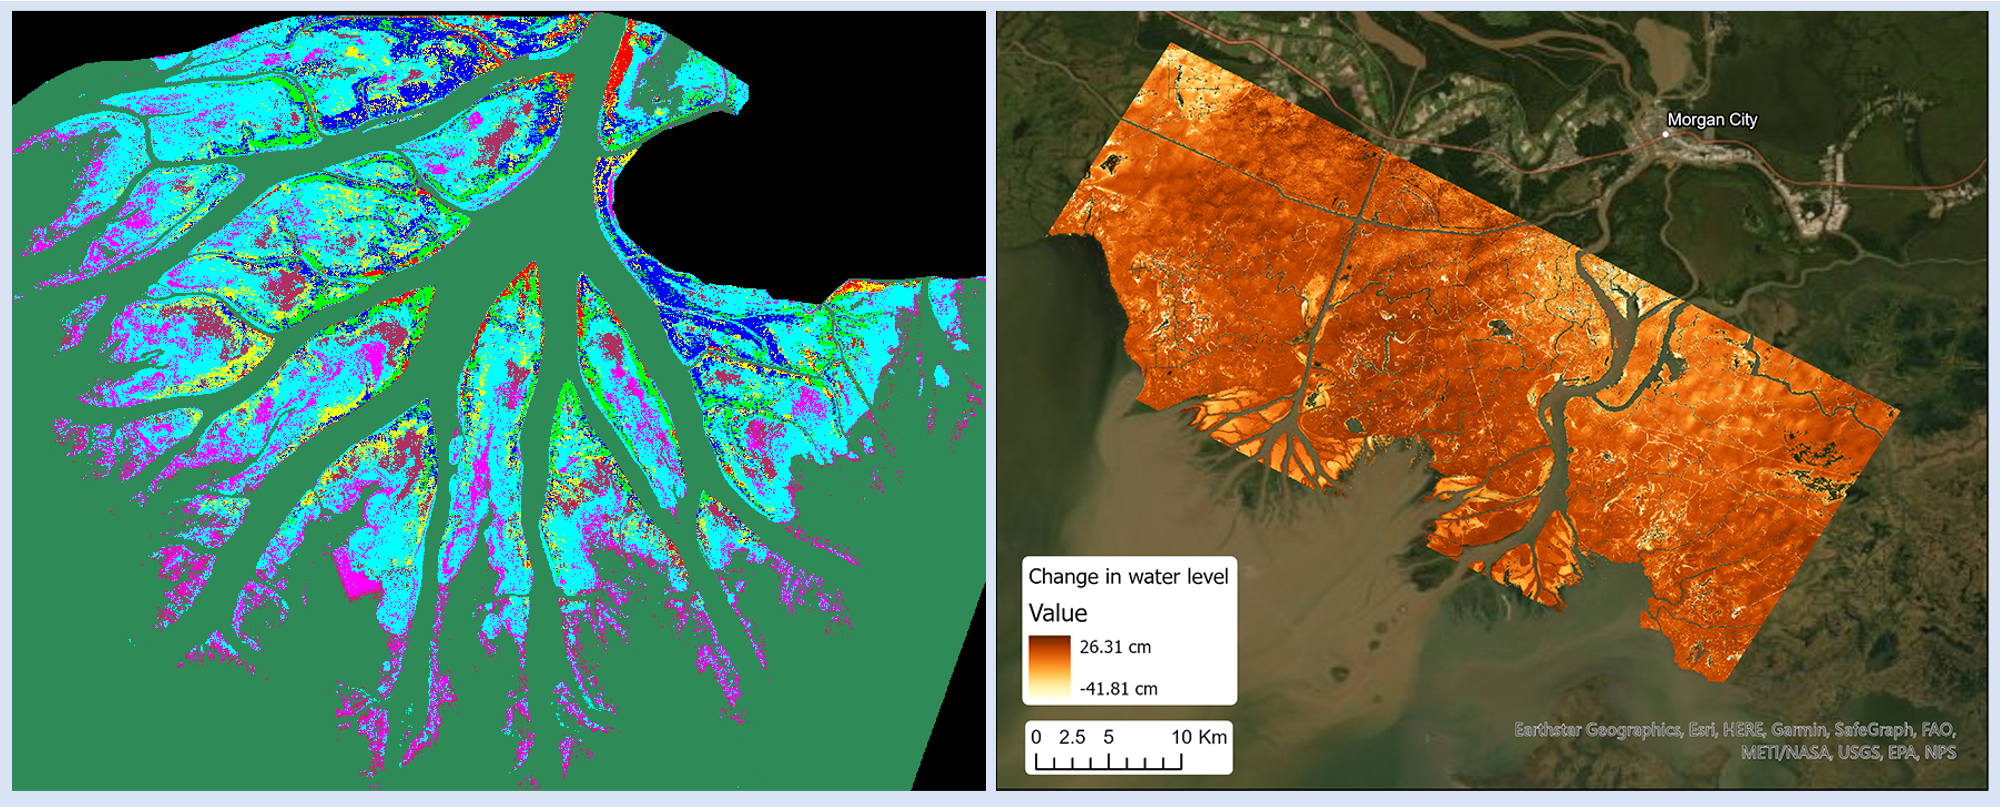
Left image: Vegetation classification of the Atchafalaya Basin, LA, using data acquired from the AVIRIS-NG sensor, 2016. Credit: Jensen, D.J., Simard, M., Twilley, R., Castaneda, E. & McCall, A. 2020. NASA’s ORNL DAAC (DOI: 10.3334/ORNLDAAC/1821). Right image: Map of water level changes based on water surface elevations measured by UAVSAR on October 16, 2016, at 14:08 and 16:37 UTC. Credit: Jones, C., Simard, M. & Lou, Y. 2020. NASA’s ORNL DAAC (DOI: 10.3334/ORNLDAAC/1823).
All of these variables help scientists better understand the processes contributing to soil accretion, which is what is needed to save these critical geomorphic systems. Changing variables within the model will provide scientists with insight as to how the delta will respond under different circumstances.
The models based on Delta-X data, once developed and calibrated, determine how much sediment will need to be put back into the system sustainably, that is, in the most natural way possible, to mitigate the impacts of a rising sea. Jones notes, “…deltas are really sensitive. They live in this balance between losing and gaining land. But if we understand all the processes developed over millennia that have kept them in balance, we will be able to reverse some of the [loss].” The Delta-X modeling framework can be used for forecasting change in other delta systems around the world by using its remote sensing and numerical model parameters.
The Application
Model output showing particle flow from the Wax Lake Delta. Developed through a Python package from Hariharan, J., Wright, K. & Passalacqua, P. (2020). “dorado: A Python package for simulating passive particle transport in shallow-water flows.” Journal of Open Source Software, 5(54): 2585 [DOI: 10.21105/joss]. Credit: NASA’s Jet Propulsion Laboratory.
The state of Louisiana has a $50 billion, 50-year plan to protect its coastline from erosion and rising sea levels. Data from Delta-X could help better inform coastal restoration efforts and sediment diversions.
According to Delta-X co-PI Simard, “In terms of application, Delta-X is very important; there is a science component of course, but application-wise we are really hoping it’s going to support decision making . . . to inform the state [of Louisiana] about remediation plans.” In fact, the Delta-X team has been interfacing with Louisiana’s Coastal Protection and Restoration Authority and the non-profit Water Institute of the Gulf in Baton Rouge to help develop sustainable coastal restoration efforts. In addition, 12 co-investigators from eight institutions, along with undergraduate, graduate, and postdoctoral students, have been involved in mission planning and will be working tirelessly in the coming months to understand this fragile ecosystem.
While the data and models from Delta-X are specifically for the Mississippi River Delta, Simard notes that, “the framework can be applied [to other deltas]. We can either take the model parameter values obtained during Delta-X to implement models elsewhere or, even better, we can have another Delta-X campaign over those other deltas to do a better job there too.”
Data Availability
To demonstrate the viability of the mission, two pre-Delta-X missions were conducted in 2015 and 2016. The data from these campaigns are archived at NASA’s Oak Ridge National Laboratory Distributed Active Archive Center (ORNL DAAC) and can be accessed at the links below:
Pre-Delta-X data in Earthdata Search
Pre-Delta-X data at ORNL DAAC
Delta-X data are expected to be available through Earthdata Search and ORNL DAAC in the fall of 2022. To keep up to date on the Delta-X campaign, read the Delta-X Science Blog.
Original Article Published April 12, 2021