 By Sarah Lang, Ph.D. student at the Graduate School of Oceanography, University of Rhode Island. // Aboard the Bold Horizon //
If you asked a random person about the color of the ocean, they would probably tell you that it’s some shade of blue or green. But perhaps that shade of blue looks slightly different to you than it does to the random stranger you’re bothering about the color of the ocean.
The way you see color depends on many things: the way an object interacts with incoming light, the color of that incoming light, and even the way your eyes perceive that light. The stranger likely has cone cells in their eyes that perceive light differently than yours.
When light from the sun enters the ocean, it is scattered or absorbed by phytoplankton (microscopic organisms in the ocean that produce oxygen, take up carbon dioxide, and serve as the base of the marine food web), organic matter, minerals, and other constituents in the water, as well as the water itself.
These interactions affect different wavelengths of light differently. Remember the electromagnetic spectrum? Let’s think of colors as different wavelengths of light.

If we can quantify how light scatters and absorbs after entering the water, we can gain a better understanding of what is in the water. This includes not only how much phytoplankton, but what species there are! This is important for better understanding the ocean’s carbon cycle. Different species of phytoplankton contribute to the ocean’s carbon cycle in different ways (eg., phytoplankton size influences how much carbon they fix), so it is important to understand their distributions.
I am a Ph.D. student at the University of Rhode Island’s Graduate School of Oceanography. I’m interested in how the physics of small-scale features in the ocean affect phytoplankton ecosystems, and I work with ocean color to better understand the biogeochemistry and ecology of the ocean.

During the S-MODE campaign, we are using ocean color to capture small-scale variability in phytoplankton species and physiology (how happy are the phytoplankton?).
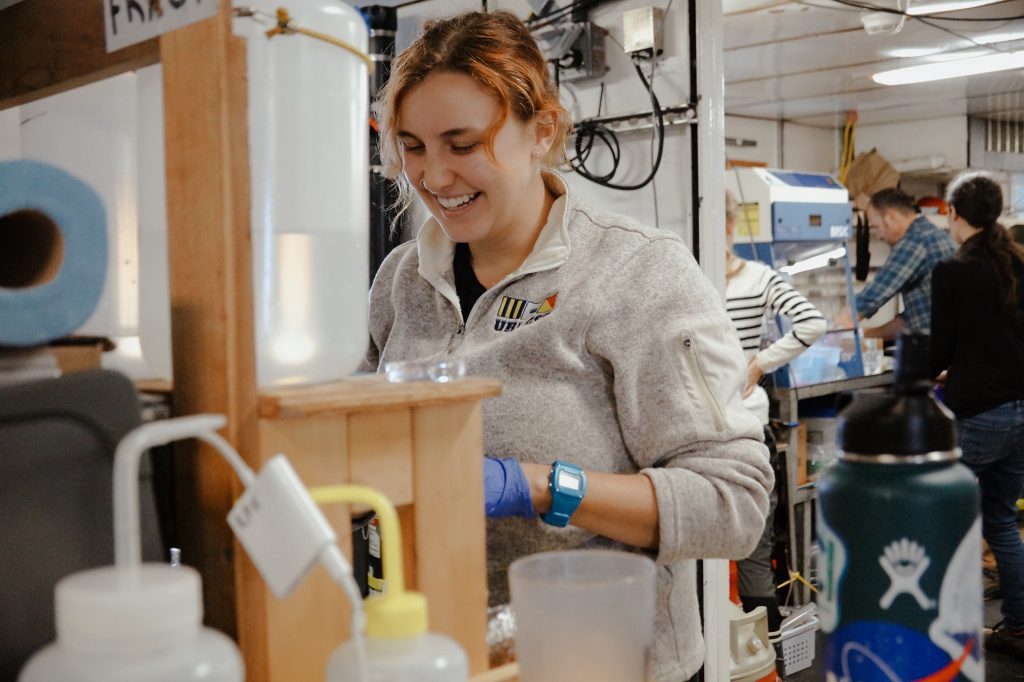
Here’s how we do it: we take many, MANY seawater samples (we took over 300!) and we analyze these samples for chlorophyll (tells us about how much phytoplankton are in the water), particulate organic carbon, pigments (what types of phytoplankton might be there?), and nutrients.


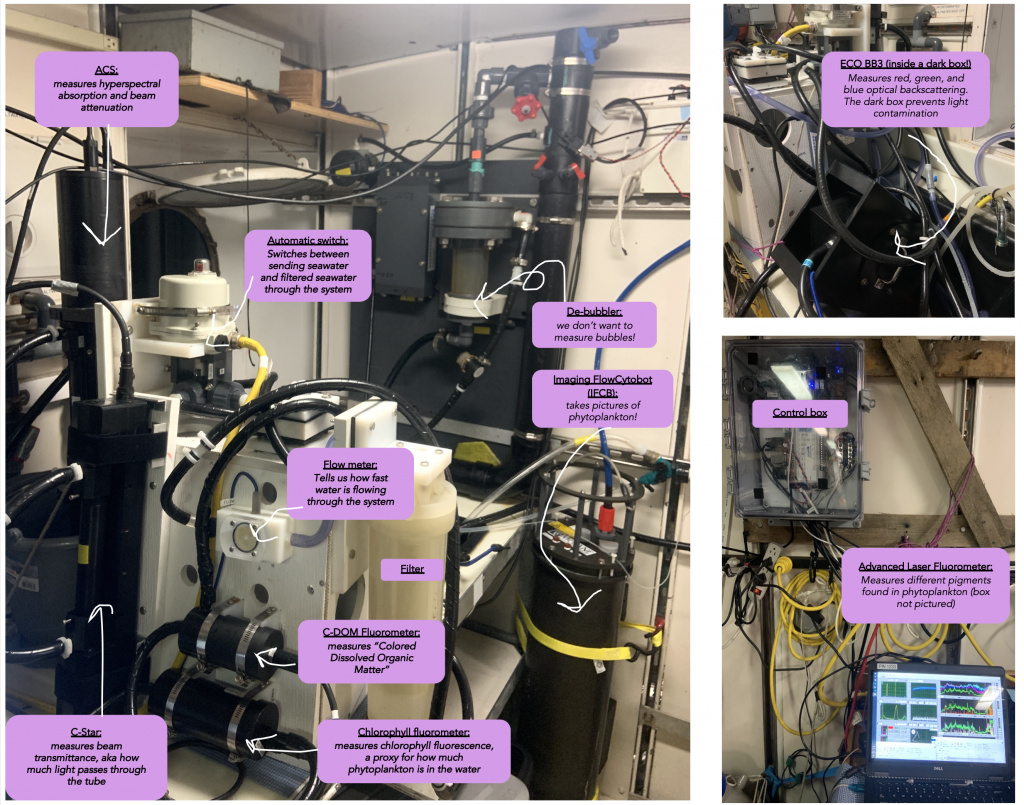
We use these samples to “calibrate” ocean color (aka bio-optical) measurements. One way we take these bio-optical measurements is from a flow-through system. We send water through a series of optical instruments that measure different optical properties of the water. Basically, we want to turn continuous optical measurements taken on the ship into biological parameters we understand (like phytoplankton!).

Then, we can use these bio-optical measurements to validate measurements from AIRPLANES! These planes (NASA PRISM: Portable Remote Imaging Spectrometer and SIO MASS: Modular Aerial Sensing System) have hyperspectral sensors on them measuring how much light is leaving the water at different wavelengths.
Hyperspectral sensors are really cool because instead of knowing how much light is leaving the water at a few wavelengths across the visible spectrum, we can capture continuous information (almost the whole spectra!). Hyperspectral measurements give us the information we need to estimate phytoplankton species.
Soon, we’ll have global hyperspectral ocean color data for the first time. We’ll be able to see the ocean in a way we’ve never seen before with NASA’s upcoming satellite mission PACE (Phytoplankton, Aerosol, Cloud, and ocean Ecosystem). New discoveries about our amazing planet will follow!
