


NASA's newest storm-watching satellites have collected their first views of hurricanes, offering scientists a new tool for understanding the inner workings of storms.
NASA’s newest storm-watching satellites have collected their first views of hurricanes, offering scientists a new tool for understanding the inner workings of storms over shorter time spans.
Data from the TROPICS mission — short for Time-Resolved Observations of Precipitation structure and storm Intensity with a Constellation of Smallsats — will help weather researchers learn more about the environmental factors contributing to hurricane structure and intensity. Such information could prove useful for NOAA, the U.S. Joint Typhoon Warning Center, and international agencies responsible for developing hurricane, typhoon, and cyclone forecasts.
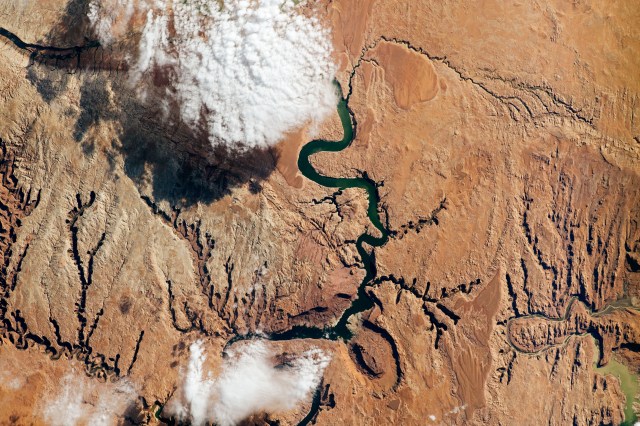
Credits: NASA Earth Observatory images by Lauren Dauphin, using data provided by the TROPICS team.
“As communities throughout the world are experiencing the growing impacts of increased extreme weather, it’s never been more important to get timely data to those who need it most to save livelihoods and lives,” said NASA Administrator Bill Nelson. “TROPICS will deliver vital information for forecasters, helping us all better prepare for hurricanes and tropical storms.”
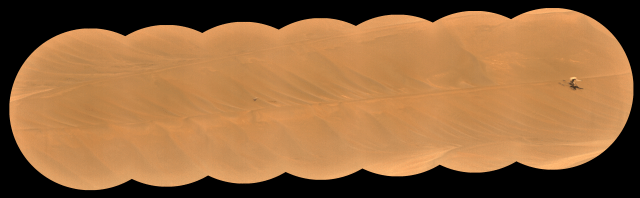
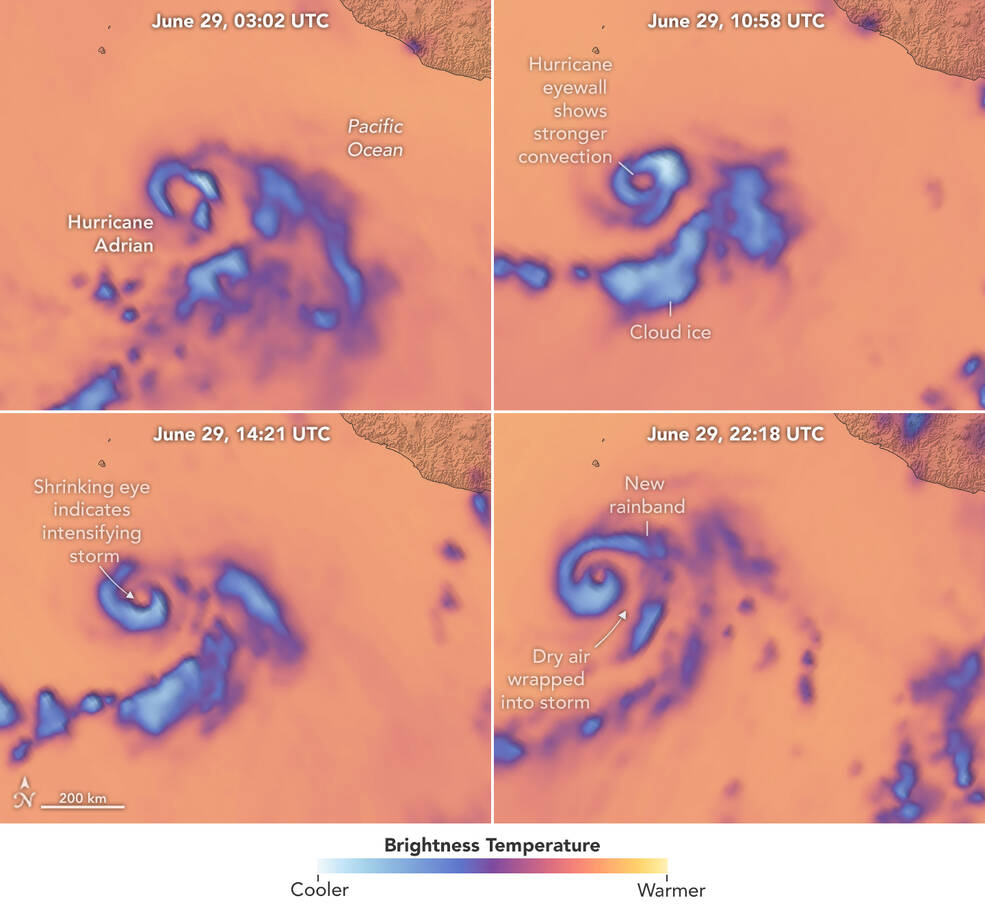
In late June 2023, the TROPICS mission acquired data for images of the first named storms of the Eastern Pacific hurricane season. Hurricane Adrian developed near the west coast of Mexico but steered away from land. The animation and stills show the evolution of the storm’s clouds from the morning of June 28 to the afternoon of June 29. (The images shown were curated from nearly two dozen taken by the satellites in that time.) Nearby, Beatriz was developing into a tropical storm, visible in these images as the less-organized clouds closer to the coast.
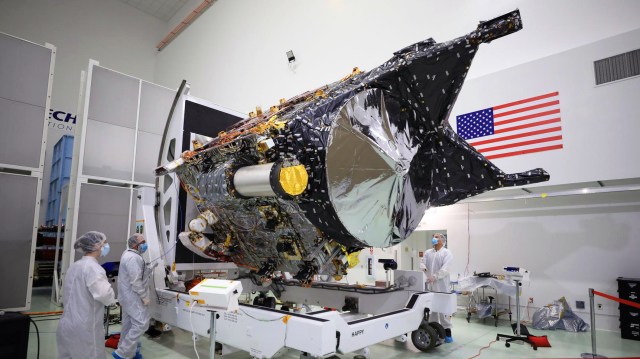
TROPICS is a constellation of four identical CubeSats designed to observe tropical cyclones. The cost-effective, milk carton-sized satellites were launched in May 2023 by Rocket Lab. Each TROPICS CubeSat contains a microwave radiometer that collects data across 12 channels to detect temperatures, moisture, and precipitation around and within a storm.
The images in the animation were built from data collected by a single channel (205 gigahertz) that is sensitive to ice in the clouds. Each scene shows brightness temperature; that is, the intensity of radiation detectable at that channel frequency moving upward from the cloud layers and toward the satellites.
Cold brightness temperatures (blue) represent radiation that has been scattered by ice particles in the storm clouds. The colder the temperature, the more ice there is likely to be in a column of the atmosphere. Ice in the clouds is an indication of intense movement of heat and moisture (convection) in a storm, noted Will McCarty, program scientist for TROPICS and program manager for weather and atmospheric dynamics at NASA Headquarters.
Scott Braun, a research meteorologist at NASA’s Goddard Space Flight Center and project scientist for TROPICS, explained that patterns observed in the brightness temperature data can indicate the location of rain bands, the intensity of convection, whether the storm has formed an eye, and how those structures are changing over time. All are important to understanding how storms will evolve.
“Structural changes in brightness temperature can help tell us whether a storm is intensifying or weakening,” said Patrick Duran, the mission’s deputy program applications lead at NASA’s Marshall Space Flight Center. These structural changes are less apparent in natural-color images, which primarily show the tops of clouds. And some features, such as the eye, often show up in microwave images before they are detected by infrared sensors on other satellites.
Similar microwave measurements can be made with other satellites, such as the Global Precipitation Measurement (GPM) mission. TROPICS, however, has a time advantage. Whereas the orbits of most science satellites only permit observations of a storm every 6 to 12 hours hours, the low-Earth orbit and multiple satellites of TROPICS can allow storm imaging about once an hour. That’s a big advantage when trying to understand a rapidly evolving storm.
“The high-revisit observations from TROPICS show detailed structure in the inner eye and rain bands of tropical cyclones,” said William Blackwell, the mission’s principal investigator at MIT’s Lincoln Laboratory. “Rapidly updated data provided by TROPICS uniquely show the dynamic evolution of the storm structure and environmental conditions.”
Some of these structural changes are apparent in the animation and image series. The first frame of the animation shows the storm’s developing eye, visible as the warmer area surrounded by cooler areas associated with clouds and precipitating ice. Around the time of this image, NOAA’s National Hurricane Center had recently upgraded Adrian from a tropical storm to a category 1 hurricane. It continued to strengthen and remained a category 1 storm throughout this image series.
In the second frame, a smaller coverage of cool temperatures indicates weakening convection, especially in the eyewall. By frame three, the eyewall shows stronger convection, and the eye appears smaller, which often occurs as a storm intensifies. By the fifth frame, strong convection is apparent south of the eye, a new rainband has developed on the north side, and the eye reaches its smallest size seen in the image series.
Story by Kathryn Hansen
NASA’s Earth Observatory
kathryn.h.hansen@nasa.gov
Media Contacts:
Katherine Rohloff
NASA’s Office of Communications
katherine.a.rohloff@nasa.gov
Karen Fox
NASA’s Office of Communications
karen.c.fox@nasa.gov