Top Menu

NASA logo
TAP

Archive | Completed Missions RSS

GRACE

GRACE

Gravity Recovery and Climate Experiment (GRACE)


https://www.jpl.nasa.gov/missions/gravity-recovery-and-climate-experiment-grace/

An award-winning mission that’s changed the way we study Earth’s gravitational forces and the Earth system, the Gravity Recovery and Climate Experiment, or GRACE, mission flew twin spacecraft in tandem around Earth to study key changes in the planet’s waters, ice sheets and the solid Earth.

In 2011, the gravity measurement technique pioneered by GRACE, which works by measuring changes in the push and pull between the twin spacecraft as they orbit Earth, was put to use on NASA’s twin GRAIL spacecraft embarking on an ambitious mission to study the gravitational forces of Earth’s moon.

In more than 15 years of operations, the GRACE satellite mission revolutionized our view of how water moves and is stored on Earth.

An award-winning mission that’s changed the way we study Earth’s gravitational forces and the Earth system, the Gravity Recovery and Climate Experiment, or GRACE, mission flew twin spacecraft in tandem around Earth to study key changes in the planet’s waters, ice sheets and the solid Earth.


HS-3

Hurricane and Severe Storm Sentinel (HS-3)


https://espo.nasa.gov/hs3/

The Hurricane and Severe Storm Sentinel (HS3) is a five-year mission specifically targeted to investigate the processes that underlie hurricane formation and intensity change in the Atlantic Ocean basin. HS3 is motivated by hypotheses related to the relative roles of the large-scale environment and storm-scale internal processes. HS3 addresses the controversial role of the Saharan Air Layer (SAL) in tropical storm formation and intensification as well as the role of deep convection in the inner-core region of storms. Addressing these science questions requires sustained measurements over several years due to the limited sampling opportunities in any given hurricane season. Past NASA hurricane field campaigns have all faced the same limitation: a relatively small sample (3-4) of storms forming during the campaigns under a variety of scenarios and undergoing widely varying evolutions. The small sample is not just a function of tropical storm activity in any given year, but also the distance of storms from the base of operations.
The Hurricane and Severe Storm Sentinel (HS3) is a five-year mission specifically targeted to investigate the processes that underlie hurricane formation and intensity change in the Atlantic Ocean basin. HS3 is motivated by hypotheses related to the relative roles of the large-scale environment and storm-scale internal processes.


[fourcol_six]

NAAMES

NAAMES

North Atlantic Aerosols and Marine Ecosystems Study (NAAMES)

Tracking plankton ecosystems to rescue the balance between our sky and ocean
https://naames.larc.nasa.gov/
http://www.journalistatsea.com/

Predict change, manage Earth’s resources and mitigate impacts,…no this isn’t the new SimCity, this is the story of Plankton and NASA’s NAAMES project

Plankton are a vital food source for ocean life and also a key indicator of climate change. Plankton are very sensitive to the temperature of the ocean, so while plankton can impact the climate, the climate can also impact plankton. So, what makes plankton bloom every year, what determines the size and duration of blooms, how do they impact the atmosphere? How will the warming surface ocean temperatures predicted to happen over the 21st century threaten plankton life? Can we change our future with the most productive ocean ecosystem on Earth?

“Our environment is changing. Our climate is changing. Ocean ecosystems are directly linked to climate. It’s hard to imagine that organisms you can’t see make a difference, but they really do.” – Mike Behrenfeld, NAAMES principal investigator, Oregon State University

The NAAMES investigation aimed to find out how the atmosphere and the ocean are intertwined through that ultimate connector, plankton. Gases and aerosols from plankton are released into the atmosphere and become the seeds of clouds. Because marine clouds are an important part of the Earth’s climate, understanding why and how plankton blooms happen, and how they influence clouds, can help us understand the Earth’s climate.

NAAMES consisted of four joint ship and aircraft field campaigns from 2015-2018 that were each performed at a specific time of the year to target different parts of the annual plankton cycle. Ship-based measurements were taken to learn about how much and what types of plankton were present at different times of the year, how fast they lived and died, and how plankton changed the ocean source of gases and aerosols. Measurements from the overflying aircraft were taken to see how aerosol concentrations varied in the overlying air and how efficiently the aerosols seeded cloud formation. The collected data was studied to help us better understand this beautiful relationship between Plankton and clouds. You can predict climate future and societal impacts with NAAMES. Come take a journey with us!

https://naames.larc.nasa.gov/video/NAAMESoverview.mp4

Related Projects

The North Atlantic Aerosols and Marine Ecosystems Study (NAAMES) is a five year investigation to resolve key processes controlling ocean system function, their influences on atmospheric aerosols and clouds and their implications for climate.


Orbiting Carbon Observatory-2 (OCO-2)

OCO2
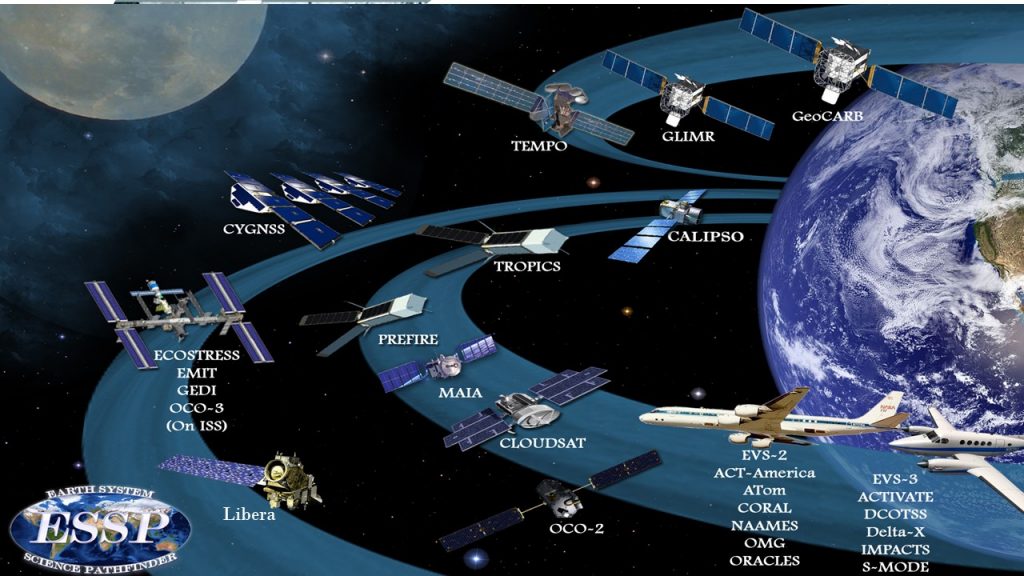
Orbiting Carbon Observatory (OCO2/OCO3)

 https://ocov2.jpl.nasa.gov/

https://ocov3.jpl.nasa.gov/


OCO-2 and OCO-3 NASA’s twin carbon chasing satellites show us CO2 sources and sinks.


OCO-2 was launched on July 2, 2014 and was the first US satellite dedicated to measuring  atmospheric carbon dioxide (CO2) from space, and it is still making measurements today! CO2 is a greenhouse gas, and it has been shown to be increasing due to human activities. OCO-2 has been measuring this change. The more CO2 that is in the air, the warmer the earth is becoming. This causes things like rising sea levels, melting glaciers and ice sheets, thawing permafrost, and droughts. Data from OCO-2 has already shown that tropical forests absorb CO2 in response to drought and warm temperatures, which would mean that CO2 will increase much faster in the future, speeding up the damaging effects of climate change. OCO-2 is critical to help us understand where the CO2 is coming from, how fast the emissions are increasing, and what we can do to reduce CO2 emissions to protect our planet.

“I definitely feel like there is an urgency to addressing Greenhouse Gasses and climate change. We’ve seen clearer information coming out about all the impacts in the world – sea ice and sea level, storms, etc. There is going to be so many impacts to people like food availability and water availability, that I think that it is important that we address this sooner rather than later. Making changes now to avoid emissions is going to more effective than adjusting to all the potential impacts. ” – Annmarie Eldering , Project Scientist, OCO-2

OCO-2 orbits around the earth from pole to pole. This lets it sample  what CO2 looks like over the entire planet and where emissions are the strongest. OCO-2 looks at reflected sunlight from the Earth’s surface and uses three spectrometers to measure gases in the atmosphere. Its data is used by scientists all over the world. Today, fossil fuel combustion and other human activities are currently contributing about 39 billion tons or 39 Gigatons of CO2 into the atmosphere each year. During the pandemic, many industries were closed, and cities and countries issued stay at home orders, keeping people off the road.

Scientists are using OCO-2 data to determine if there was an impact on CO2 emissions due to the COVID-19 pandemic. The data from OCO-2 remains very valuable and the OCO-2 mission will continue to contribute to scientific investigations that are related to the global carbon cycle.

How are NASA’s OCO-3 and OCO-2 different? The OCO-3 spectrometer (instrument) is a duplicate of OCO-2, and in fact was made from spare parts from OCO-2. They both measure CO2 over the earth using reflected sunlight, and they both provide a significant amount of information about climate change. What is different is where they are in space. While the older sibling OCO-2 orbits the earth from pole to pole, the younger sibling OCO-3 is hitching a ride on the International Space Station (ISS)! The path that the ISS takes around the Earth is very different from the path of the OCO-2 satellite, and this means that OCO-3 sees the earth in a different way. OCO-3 will be able to measure different regions of the Earth at all different times of day, so we can see how CO2 is changing throughout the day over forests. OCO-3 is also able to swivel and point to a compact, city-sized area to get more details on CO2 behavior.

Along with OCO-2, OCO-3 will show us what the emissions of CO2 are around the Earth, and how it is absorbed by forests and impacting their health. We can use data from the instruments to find some plumes from power plants and cities. The two OCO siblings are helping us understand climate change and how we can prepare for the future climate.


The Orbiting Carbon Observatory-2 (OCO-2) model intercomparison project (MIP) is a collaboration among atmospheric CO2 modelers to study the impact of assimilating OCO-2 retrieval data into atmospheric inversion models. The results from the set of simulations performed by this project have been released as a level-4 flux product.


Oceans Melting Greenland (OMG)

Oceans Melting Greenland

https://twitter.com/omgnasa?lang=en

Probing melting glaciers from the sky, exploring the journey of ocean water

You see the tip of a melting iceberg; we see a plane, an ocean, a probe, and OMG… We jump inside!

NASA’s Oceans Melting Greenland (OMG) mission is right here on Earth and it’s showing us the precise role oceans are playing in melting glaciers. Some glaciers in Greenland have been around for a million years; however, in just the last few decades, they have begun disappearing due to climate change. Greenland’s glaciers are massive – if all of those glaciers were to melt, the sea level would rise 25ft; that could translate to Washington DC being under water in the future. (Check your home town or favorite beach here) The glaciers are being attacked from all sides, from the air above and now OMG is discovering, from warm water underneath. The sea floor around Greenland has channels that snake up into the continental shelf and the warm salty water rides right up onto the front of the glacier. Warmer water, means faster glacier melt and losing more of our precious coastline.

“Amazing flight today through the dramatic canyons beyond Scoresby Sound. Got the first data in front of Vestfjord Glacier, which was almost 600m deep. Dropped 26 probes (total 193) and got 23 good profiles. #omgnasa” – Josh Willis, OMG Principal Investigator

OMG uses two planes, a satellite, a ship and elusive narwhals measure how the glaciers and oceans change from year to year. Aircraft launch 250 big, grey cylinder probes into the ocean every summer, the only time there is open water and less ice around most of Greenland. As the probes sink to the ocean floor, they radio back temperature and salinity measurements from the surface to the sea floor back to the team. In addition, both the shape and depth of the sea floor (bathymetry) were measured by ships and airplanes. Whales become oceanographers, gathering temperature, salinity and dive depth data while they feed at glacier waters. This project is changing the way scientists think about the melting of Greenland’s glaciers from underneath! See how temperature has changed in 5 years and what is going to happen in the 6th year, 2021. Come ride along with a narwhal whale and a NASA radio transmitter to discover more.

Check out other Earth Pathfinder projects to see if this melting can be reversed and follow OMG on the tracker at https://airbornescience.nasa.gov/tracker/#!/status/map?callsign=C-GJKB

NASA’s Oceans Melting Greenland (OMG) mission is right here on Earth and it’s showing us the precise role oceans are playing in melting glaciers. Some glaciers in Greenland have been around for a million years; however, in just the last few decades, they have begun disappearing due to climate change. Greenland’s glaciers are massive – if all of those glaciers were to melt, the sea level would rise 25ft; that could translate to Washington DC being under water in the future.


ORACLES

ORACLES

Observations of aeRosols Above CLouds and their intEractionS (ORACLES)

Determine the impact of African biomass burning aerosol on cloud properties and the radiation balance over the SE Atlantic and acquire a process level understanding of aerosol-cloud-radiation interactions


RaD-X

RaD-X


The NASA Radiation Dosimetry Experiment (RaD-X) high-altitude balloon mission was successfully launched from Fort Sumner, New Mexico on 25 September, 2015. Over 20 hours of science data were obtained from four dosimeters at altitudes above 20 km. It provided first-time indications of how cosmic rays deposit energy at the top of atmosphere – which produce showers of additional particles that increase the energy deposited where commercial airlines fly. The data from this experiment will improve NASA’s Nowcast of Atmospheric Ionizing Radiation for Aviation Safety (NAIRAS) model, which is currently used by public and private entities for informed decision-making about radiation exposure safety for flight crews, the general public, and commercial space operations.

Powered by WordPress. Designed by WooThemes