NASA scientists will be teaming up with epidemiologists in the agency’s first health-focused mission. With satellite data, they’ll find out how air pollution affects health in cities around the world.

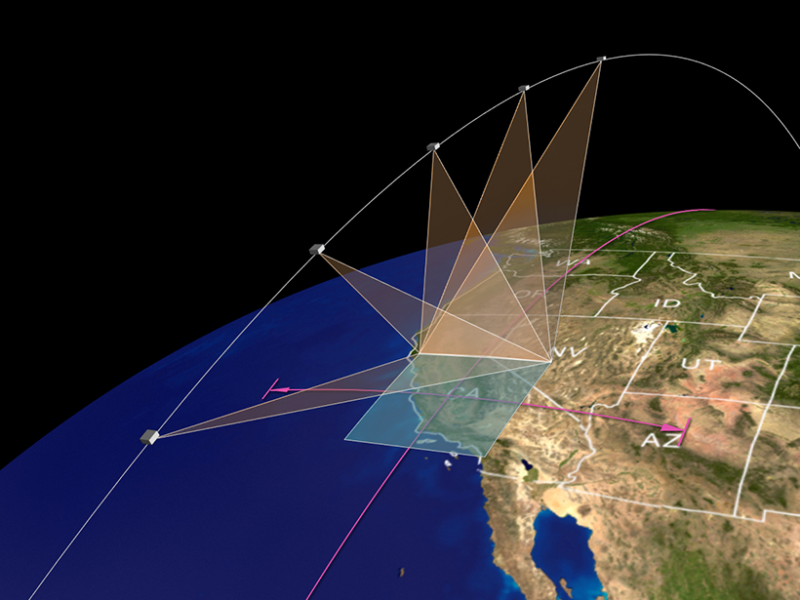
This map illustrates MAIA’s multiangle measurement approach. Credit: NASA/JPL-Caltech
By Jackie Rocheleau 15 April 2021
For epidemiologists studying air pollution, there’s only so much to learn at ground level. So they’ve been taking advantage of aerosol data from NASA satellites to link health outcomes with local air pollution. But only recently have NASA and epidemiologists teamed up to start the space agency’s first mission focused on health.
NASA’s Multi-Angle Imager for Aerosols (MAIA) mission, scheduled for launch in 2022, will combine the expertise of planetary scientists and epidemiologists to answer a question that, before now, has been largely impossible at a large scale: What kind of air pollutant particles is most harmful to human health?
Of the different types of air pollutants, particulate matter (PM), especially particles smaller than 2.5 micrometers (PM2.5), poses some of the most severe health risks. These particles, which primarily form from combustion sources like fossil fuel use and wildfires, vary in composition but are small enough to pass from the lungs into the bloodstream. From there, they can travel all over the body. In the short-term, high PM2.5 levels in the air exacerbate respiratory diseases, whereas long-term exposure can even lead to premature death from heart and lung conditions. Scientists are predicting that climate change could worsen PM2.5 concentrations in some regions, though concentrations could decrease where emission sources are reduced. But even exposures below what regulators consider dangerous are associated with poor health outcomes, like increased mortality in older adults.
“We need to know what about the particles is the most toxic.”
To protect health, scientists need to know which PM components and sources are most harmful. Because PM sources differ between communities, that’s been a problem. “We can’t generalize from a traffic-related-pollution cardiovascular disease or a dementia link in urban areas to a rural area with mostly wood burning,” said Beate Ritz, an epidemiologist and environmental health scientist at the University of California, Los Angeles, and a MAIA coinvestigator.
There’s also the added complication that PM is classified by size, not by kind. “It’s easy to measure the size, not the type,” said Patrick Kinney, Beverly Brown Professor of Urban Health at Boston University. Relative to ground monitoring techniques that record concentrations and sizes of PM, there’s expensive laboratory analysis needed to tease apart particulate types. “We need to know what about the particles is the most toxic,” said Ritz.
Enter MAIA
For the past 20 years, health researchers have been using publicly available data from NASA’s Multi-angle Imaging Spectroradiometer (MISR) instrument to associate air pollution with health outcomes. But “an outstanding question is ‘which particular types and sources of particles are the most harmful?’” said David Diner, a scientist at NASA’s Jet Propulsion Laboratory and principal investigator of both MISR and MAIA.
Data from MAIA could answer that question. Aboard a commercial satellite from General Atomics Electromagnetic Systems, MAIA will circle the globe in low-Earth orbit for 3 years, passing each target study area three times per week at the same local time each pass. To infer the composition of PM2.5, scientists will use the optical properties of particles measured by MAIA: the polarization of sunlight scattered by particles and images of the light at multiple angles in 14 electromagnetic wavelengths spanning from ultraviolet to short-wave infrared. Researchers will map PM2.5 concentrations and composition at the neighborhood level (a resolution of 1 square kilometer) in its 12 primary target cities in North America, Europe, Africa, and Asia. Atmospheric chemistry, spatial, and statistical models will integrate the MAIA data and information from ground-based monitors to output a complete picture of ground-level concentrations of PM and components of PM2.5 in the target areas.
Kinney, a member of the independent scientific oversight committee but not part of the project, is excited about MAIA’s potential. But he’s cautious about taking satellite-based measures at face value. “We still should be careful to understand what the satellites are measuring,” he said. Like other satellite-based instruments, MAIA doesn’t measure particulates themselves, he said, but how they interact with light. (At ground level, scientists use filters to capture actual particles.)
Going Global
Epidemiologists plan to learn which particles are most toxic by linking PM data and population health records in each target area. They’ll study short- and long-term effects of PM exposure and adverse birth outcomes and cardiovascular disease, common issues tightly tied to air pollution.
The data, scientists say, are scalable. “There are many parts of the world where, especially in low- or middle-income countries, there’s just no ground-level monitoring or very, very sparse ground-level monitoring,” said Ritz.
“As time goes on, if we find out which components are driving the health effects, then that’ll help us target interventions.”
“We can do these health outcome studies in countries that do not have electronic medical records,” she continued. “If we can get [birth] data and mortality data in terms of cardiovascular disease, that’s enough to show that there’s an impact from air pollution on these outcomes.”
Ultimately, MAIA’s broad, high-resolution data will allow researchers to understand which communities are most affected by air pollution and what sources are responsible. For the past few years, Ritz has been working with interested scientists in MAIA’s target areas, helping them set up their research infrastructure. “What’s important about MAIA is that it will build these models based on very [data] rich areas, like Los Angeles,” said Ritz. “But then, [researchers] will apply these models to other parts of the country or the world, where ground monitoring doesn’t exist.” That kind of data, Ritz said, could provide momentum for air pollution regulations.
“It could help us understand the disparities in exposure and also understand how to address them by going after the sources that are responsible,” said Kinney. “And as time goes on, if we find out which components are driving the health effects, then that’ll help us target interventions.”
—Jackie Rocheleau (@JackieRocheleau), Science Writer
This story is a part of Covering Climate Now’s week of coverage focused on “Living Through the Climate Emergency.” Covering Climate Now is a global journalism collaboration committed to strengthening coverage of the climate story.
Reposted from original story
Citation: Rocheleau, J. (2021), Using satellite data to map air pollution and improve health, Eos, 102, https://doi.org/10.1029/2021EO157069. Published on 15 April 2021.
Text © 2021. The authors. CC BY-NC-ND 3.0
Except where otherwise noted, images are subject to copyright. Any reuse without express permission from the copyright owner is prohibited.

