Look around. Can you see the air? No?
Luckily, many of NASA’s Earth-observing satellites can see what the human eye can’t — including potentially harmful pollutants lingering in the air we breathe. From the vantage point of space, these satellites help us measure and track air pollution as it moves around the globe and have contributed significantly to our decades-long quest for cleaner air.
When we talk about “air pollution,” we’re referring to chemicals or particles in the atmosphere that are known to have negative health effects on humans. The Clean Air Act of 1970 established legislation that requires the tracking of six of those pollutants — nitrogen dioxide (NO2), ground-level ozone, carbon monoxide, particulate matter (microscopic specks of solid or liquid material in the air), sulfur dioxide, and lead. Satellite instruments are measuring all of these except lead.
NASA has been involved in the study of air quality for decades from space and with ground sensors, creating a time series of global data records critical to understanding the impacts and causes of air pollution and to helping design solutions. This article highlights a few of the many projects under way now and planned for the years to come.
Credits: NASA’s Goddard Space Flight Center/Scientific Visualization Studio
Download This Video in HD from NASA Goddard’s Scientific Visualization Studio
Measured in Space, Used on Earth
In analyzing spaceborne data, one thing is abundantly clear — reducing emissions from human activities can have a profound effect on air quality.
China’s recent large-scale response to the COVID-19 pandemic, which included quarantines and limitations on industrial activities and travel, is a particularly vivid example of this. Data from instruments on NASA’s Aura and the European Space Agency’s Sentinel-5 satellites showed a significant decrease in nitrogen dioxide (NO2) — a noxious gas emitted by power plants, industrial facilities and motor vehicles — over much of the country during that time.
The pandemic presents a unique use-case for spaceborne Earth observations; however, satellite-derived air quality data have applications across a wide array of disciplines. That’s where NASA’s Health and Air Quality applications program demonstrates its value. The program builds invaluable partnerships with other agencies, industry and nonprofits to facilitate the use of this data in solving real world problems.
“We funded a project led by the Environmental Protection Agency (EPA) to assimilate NASA Earth observations into their “AirNow” system,” said program manager John Haynes.
The AirNow system is the EPA’s platform for distributing national, real-time air quality reports and forecasts. The measurements primarily come from thousands of monitoring stations on the ground across the United States, Mexico, and Canada; however, those ground monitoring stations are not all-encompassing.
“The ground monitors cover a good part of the U.S., especially around metropolitan areas. But there are large sections of the country that don’t have monitoring stations,” said Haynes. “By introducing satellite aerosol optical depth observations from the MODIS instrument, we can measure those areas too, which allows us to form a more accurate image of how air pollution — and specifically fine particulate matter — is distributed across the country and how it changes over time.”
By incorporating data from the Ozone Monitoring Instrument (OMI), a Dutch-Finnish contribution to NASA’s Aura satellite mission, the EPA and NASA were also able to identify a significant drop in NO2 over the last 15 years in the United States — evidence that regulations put into place by the Clean Air Act 50 years ago — vehicle gas mileage regulations, a shift to cleaner fuels, and so on — are, indeed, working.
“We’ve been able to show that since 2004, NO2 levels have dropped as much as 50% depending on what metropolitan area we’re talking about. In fact, the air in the United States is now the cleanest it has been in the modern industrial era,” Haynes said.

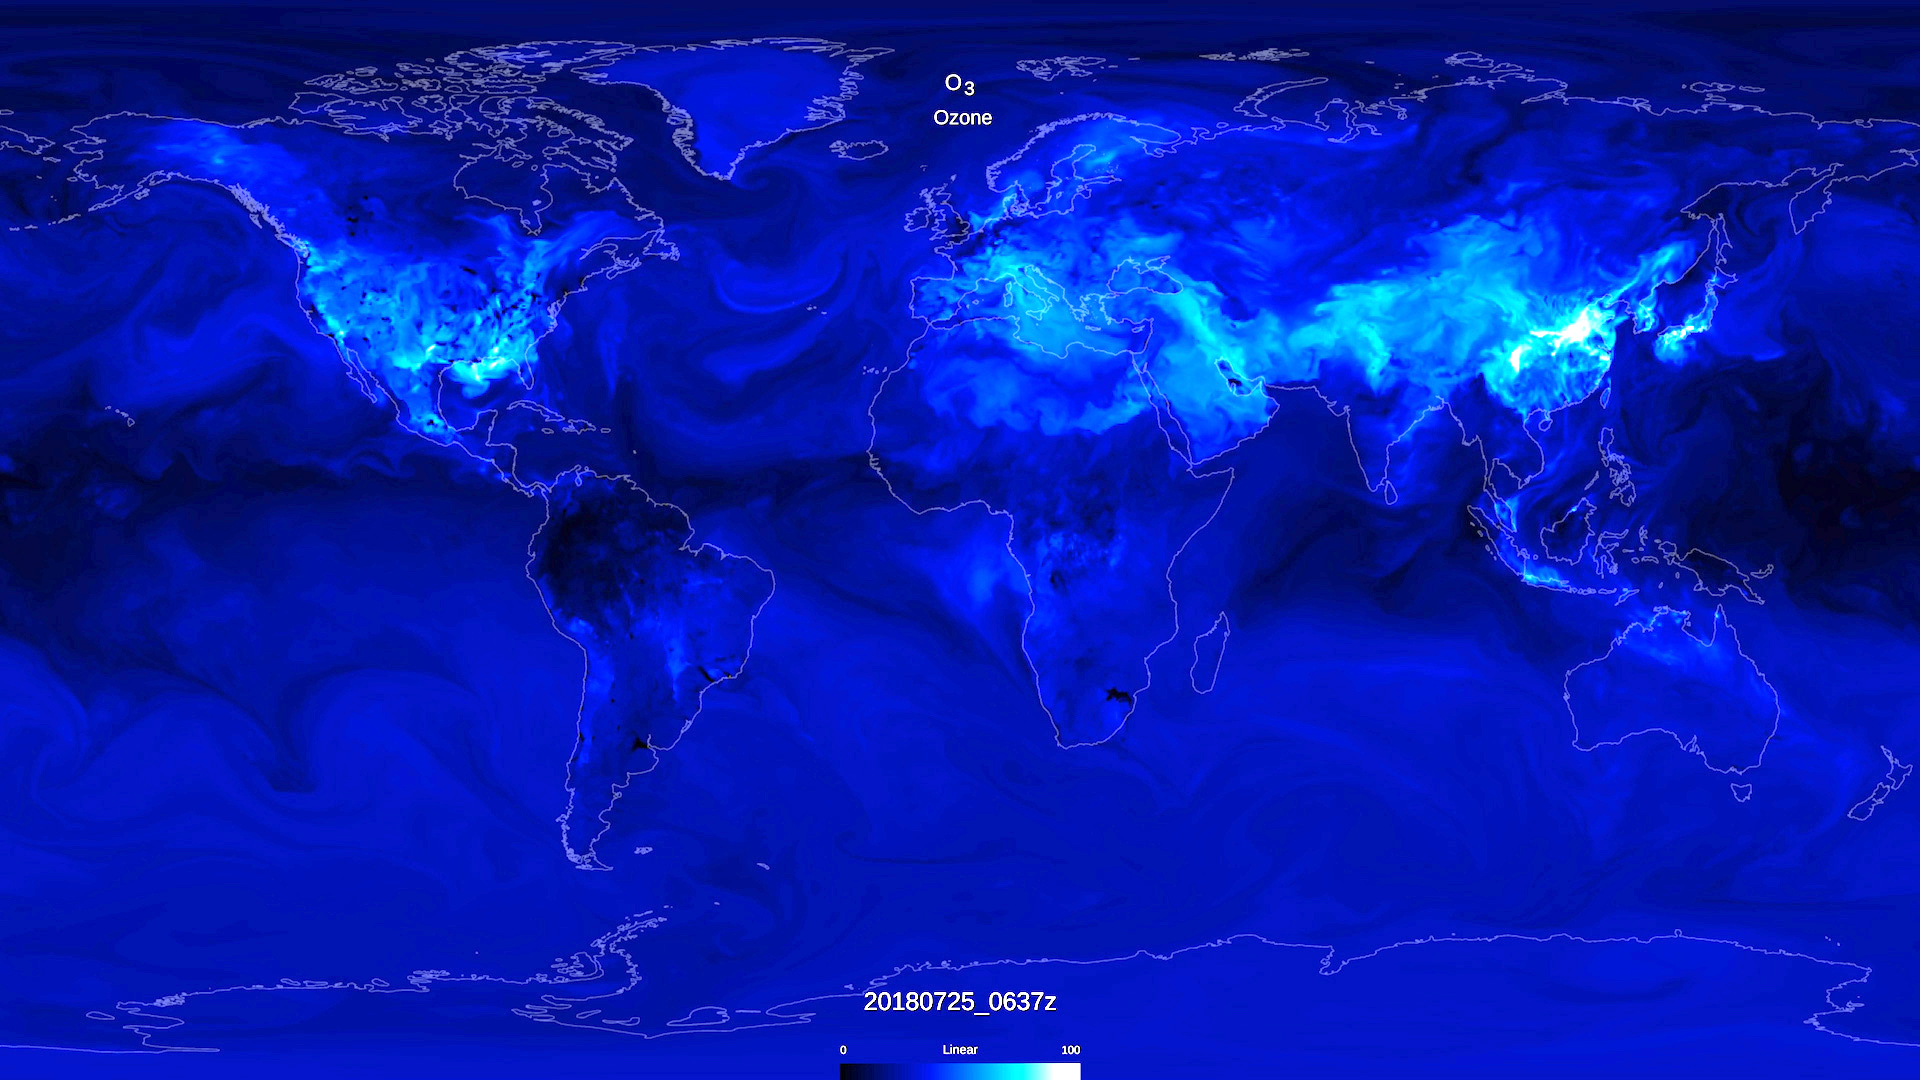
While ozone in the stratosphere is critical to maintaining life on Earth, surface ozone, shown here, is a toxic gas to most plant and animal species. NASA merges satellite data with models to provide a snapshot of chemistry throughout the atmosphere at any given time and help predict air quality worldwide.
Credits: NASA’s Goddard Space Flight Center/Scientific Visualization Studio
Connecting the (data) dots
With the abundance of data coming in — there are dozens of Earth-observing satellites currently on orbit — one of the biggest challenges is connecting stakeholders with the right “tools” or datasets for what they’re trying to accomplish, and in some cases, teaching them how incorporate this type of data into their planning.
“To address this issue, our team has developed a website where we help users navigate all of these resources, from someone who has never really used satellite data before to more advanced stakeholders looking to make better decisions and inform the public on issues of air quality,” says Tracey Holloway, leader of the NASA-funded Health and Air Quality Applied Sciences Team (HAQAST), a group of air quality and public health scientists from government offices and universities across the country.
Wildfires in California, for example, have caused air quality concerns in recent years. A HAQAST tiger team was able to look at emissions and develop new methods for using existing data from the VIIRS and MODIS instruments to support the state of California in its understanding and quantification of emissions. HAQAST also helped to get data from newer satellites like GOES-16 into the state’s hands.
According to the Global Burden of Disease report, air pollution is the leading environmental cause of mortality — a statistic of which many in the public health sector are well aware. And the availability of satellite observations is changing the dialogue around it.
“Just within the health community, we have observed the growing trend of research collaborations that bridge expertise across environmental health disciplines. As we continue to train the global health workforce, we must identify the skillsets that can prepare the workforce to manage the emerging risks of the future. For example, one skillset is the knowledge and use of innovative data sources – including satellite data – whether they apply data for research purposes or interpret findings for educational outreach activities,” said Helena Chapman, associate program manager of NASA Health and Air Quality applications.
Holloway adds, “The abundance of satellite data right now is amazing. Just in the past 10 years, it’s been remarkable how many agencies, nonprofits, cities and states have gone from not even knowing satellites could detect air pollution to actively using the data in their day-to-day operations.”
Looking Ahead
Right now, our satellites can measure a number of chemicals in the air over the United States and globally on a daily basis. But several missions scheduled to launch in the next few years will be able to do even better.
For example, the Tropospheric Emissions: Monitoring Pollution (TEMPO) mission is designed to measure several different pollutants — including NO2 and ozone — over the United States during every daylight hour. TEMPO will give scientists the ability to see how pollution sources and concentrations change throughout the course of a day. Part of an international constellation of like satellites that includes South Korea’s Geostationary Environment Monitoring Spectrometer (GEMS), and the European Space Agency’s Sentinel-4, TEMPO is scheduled to launch in 2022.
The Multi-Angle Imager for Aerosols (MAIA) mission, also scheduled to launch in the early 2020s, will improve our understanding of particulate matter — those tiny, microscopic particles lingering in the air — with particular focus on large metropolitan areas. Data like this will help the health community better understand the connection between aerosol pollutants and health problems including adverse birth outcomes and cardiovascular diseases.
“MAIA will allow us to study these aerosols in detail, tell us how big they are and how many of them are in that very small category that is most harmful to human health,” said Barry Lefer, program scientist of NASA’s Tropospheric Composition program. “We’ll also be able to better understand what the particles are made of which will lead us to where they came from (like auto exhaust for example).”
Even further in the future, the possibilities are many.
“I’d love to see a future where real-time Earth observation data is seamlessly and continuously available to everyone — from orbit to the palm of your hand,” said Haynes. “It would allow anyone to make fast decisions regarding air quality and their health.”
NASA’s Earth Science News Team


