Top Menu

NASA logo
TAP

Archive | scale-image RSS

Preparing for Landing: NASA’s S-MODE Wraps up Last Week of Experiments

By Dragana Perkovic-Martin, Principal Investigator for DopplerScatt at NASA’s Jet Propulsion Laboratory // SOUTHERN CALIFORNIA //

11/02/21

Yesterday was a hard down day for the team – everyone needed a rest after a very active week before. The hard down days are in NASA airborne rules and ensure that fatigue does not set in and keep everyone’s safety the top priority.

The NASA King Air B200 and the early morning fog at NASA Ames Research Center.

Spooky! NASA King Air B200 and the early morning fog at NASA Ames Research Center. Photo credit: Alex Wineteer / NASA JPL

To fly or not to fly … Today is supposed to be a good day for optical measurements but the pesky fog is really not willing to leave the area of S-MODE operations. We sit and wait for updates from the ship, satellite imagery and forecasts. In the meantime, we are using the Saildrone measurements of wind speed in the area of interest to determine if it’s worthwhile to operate DopplerScatt. The winds are very low. The hourly reports are telling us that the winds have been below DopplerScatt’s threshold for the whole morning, reporting wind speeds of one meter per second. At this wind speed the ocean surface is very still, so still that it may look like a mirror. This is bad news for radar signals bouncing off the surface as their strength depends on the surface roughness. No dice for DopplerScatt today, and the same decision was made for the MOSES and MASS instruments on the Twin Otter.

11/03/21

Remember that pesky problem with the monitor from last week? I overnighted a replacement monitor for the DopplerScatt team since yesterday was a doozy with no flights, they decided to swap out the monitor and keyboard on the plane. Trouble is they did not test that it worked. We just thought, “well what could go wrong, it’s the same model.” What do you know, it did go wrong! I’ll spare you the details and the frantic messaging between myself and the operators, but after some time they realized that the power cable was not plugged in and the monitor was not getting power. All in a day of DopplerScatt deployments!

Crew in front of the NASA King Air B200.

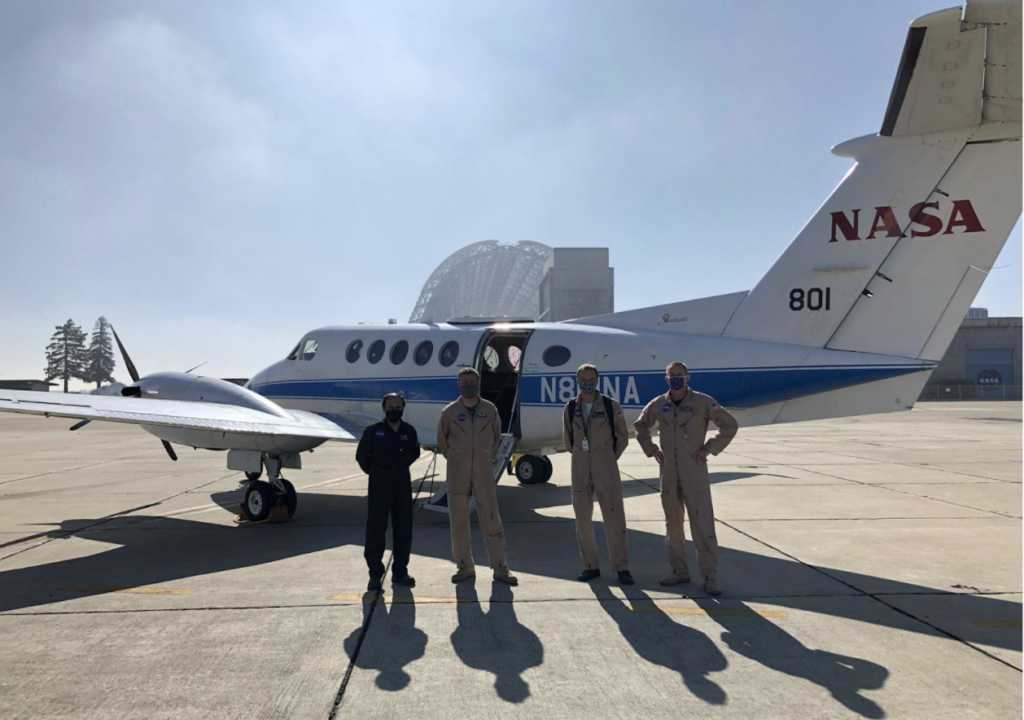
Crew of the day from left to right: Karthik Srinivasan (JPL DopplerScatt operator), Hernan Posada (AFRC pilot), Jeroen Molemaker (UCLA MOSES operator), James Less (AFRC pilot). Photo credit: Alex Wineteer / NASA JPL

11/04/21

Today is a science extravaganza! We have a big day ahead of us with two NASA King Air B200 flights planned and all of the in-water assets sampling data throughout the day. The weather is finally cooperating and we have a clear yet windy day ahead of us. The plan today is to fly a morning flight – which just took off at 8am – and then another one leaving approximately 6 hours later and flying the exact same pattern. The comparison of data between the two will tell us about the daily variability of the ocean processes.

“This is one of the reasons why I am so excited about S-MODE,” said Hector Torres, DopplerScatt team member, operator and one of the main people responsible for simulating ocean processes. “The results based on theory and numerical simulations produced in the last five years are about to get confirmed or debunked today. Either way it will be a breakthrough!”

Flight one is now done! There were some pesky low clouds right in the area of collection that prevented MOSES from collecting quality data for half of the flight, but the second half was great. DopplerScatt data collection went as planned and data are churning already! We are seeing the first quick look data products trickle in as we watch the afternoon flight take off.

While the first flight was a bit difficult for our optical colleague running the MOSES system, Jeroen Molemaker from the University of California, Los Angeles, the afternoon was gloriously clear and provided a great opportunity for all airborne instruments to collect data at the same time.

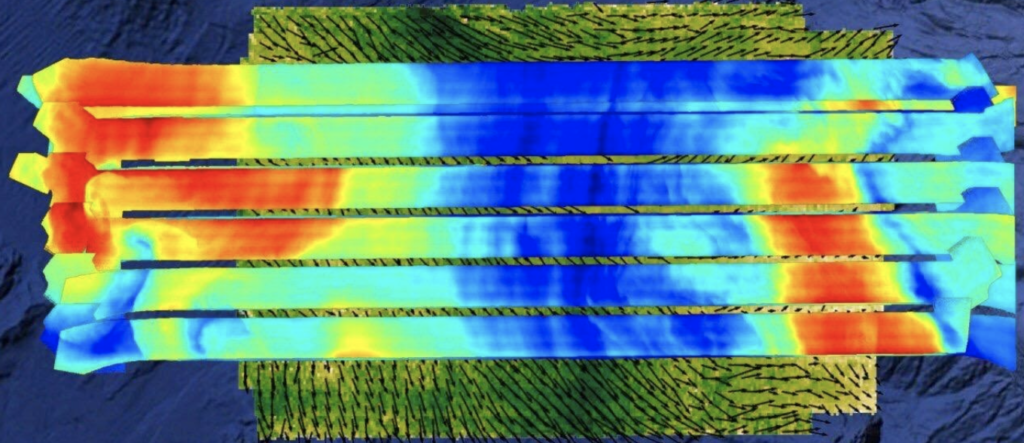
Quick look composite image of the sea surface temperature as observed by the MOSES instrument on the November 4, 2021 afternoon flight. The tracks are overlaid on DopplerScatt derived surface current velocities from the morning flight, showing the spatial relationship between currents and density fields. The color scale blue to red has a range of 2°C. Credit: NASA’s S-MODE team / Jeroen Molemaker

Today the S-MODE pilot experiment operated as we envisioned many months ago, with all platforms sampling data throughout the day over the area of interest. The field experiment crew is tired but happy and the team is excited about the science that we will extract from this data set.

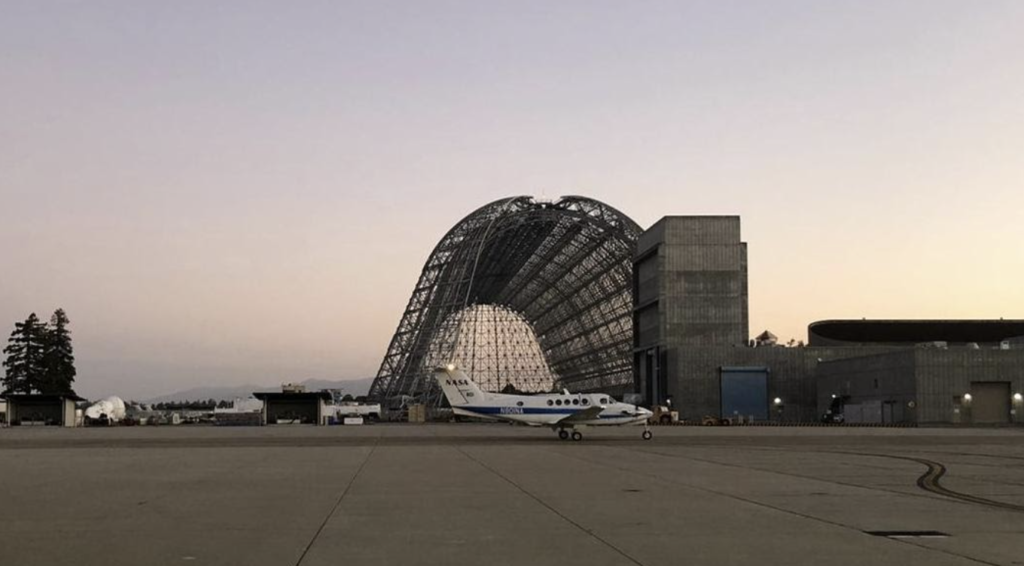
Goodnight moon. NASA King Air B200 on arrival at Moffett Field, California after a long day of flights. Photo credit: Alex Wineteer / NASA Jet Propulsion Laboratory

11/05/21

Today is the final day of the S-MODE pilot campaign. It’s a bittersweet feeling for me as it was so much fun to collaborate and coordinate daily activities with so many people. I will miss that, but I certainly will not miss the hectic calls of “we have a problem with …”

The NASA King Air B200 will fly in the afternoon collecting data in the western region of the S-MODE study area together with the Twin Otter aircraft. Meanwhile, our friends on the ship will start recovering the autonomous assets and make their way toward Newport, Oregon.

Trouble struck again as our GPS unit could not get itself aligned and produce a good navigation solution, requiring a power reset and making S-turns i.e. banking the aircraft left and right in succession. After this excitement things went smoothly for the rest of the flight. You never know what will go wrong during a field deployment, you just know that something will and you need to be prepared to react and fix things without letting the panic set in! Thankfully that is what happened today thanks to Alex Winteer, a DopplerScatt operator from NASA JPL. He performed a cool and collected power reset while in air!

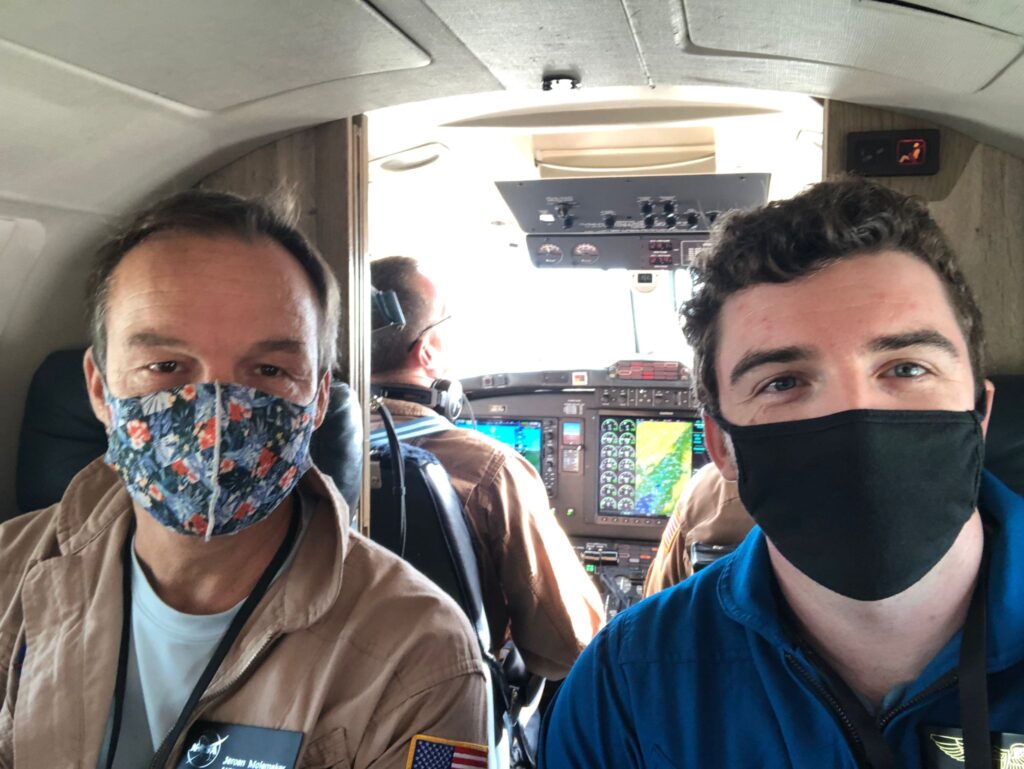
Happy crew on their last flight of the S-MODE pilot campaign. On the left is Jeroen Molemaker (UCLA MOSES operator) and on the right is Alex Wineteer (JPL DopplerScatt operator). Photo credit: Karthik Srinivasan / NASA JPL

Now it is time to work on our post-deployment to do list and eagerly await results of data processing.

I will leave you with two short blurbs from DopplerScatt team members Alex and Karthik about their impressions of the pilot campaign.

“On most days, you don’t wake up looking forward to a boring day. As an instrument operator, a boring day during a deployment, however, is a different story. You look forward to sitting in a small round aluminum tube for 4.5 hours with nothing to do. That is a perfect day – a day when the radar just works. No last minute excitement of monitors not turning on (because someone unplugged it and forgot to plug it back in!) or the satellite phone connection not working. While the entire science team is excited about an action-packed day of coincident data collection, all the instrument operators look forward to is a day where everything just works as it should! Of course, sitting in an aluminum tube for many hours, staring out at the ocean with nothing to do makes you yearn for some excitement, but that is a fleeting thought until you get a text message via satellite link asking you to pay attention to the speed of the aircraft!”

– Karthik Srinivasan, NASA JPL DopplerScatt operator

“I’ve been on quite a few field deployments with DopplerScatt, but none quite as exciting – or as important—as this one. Indeed, such a coordinated effort consisting of multiple aircraft and many assets in the water has never been attempted, and the resulting science will lead to new understanding of our ocean, atmosphere and the climate system as a whole. On Thursday, we attempted two flights for the first time. I operated the first flight: crew brief at 6:30 AM with a takeoff time of 8 AM. Thankfully, our instrument operated normally, and we were able to fly a bit lower –under the clouds – to ensure MOSES could see the ocean surface with its infrared camera. We landed five hours later, at around 1 PM, and I immediately took our data back to our field processing center in the aircraft hangar to start crunching. In the meantime, Karthik took off for our second flight of the day. By the time I finished the first round of processing, it was 5 PM and Karthik was almost back from the second flight, so I went downstairs to welcome him back (and grab the data!). A few hours later, we had both flights processed to quick look data products and I was exhausted. Being just one person, a small part of a much larger mission, it can be easy to lose sight of why we do this, especially when the hours are long. But when the data started pouring in, my exhaustion was quickly replaced by excitement. We were seeing a dataset no one had ever seen before. With these two flights, we are able to not just see the sub-mesoscale structure of the ocean surface over a large area, but we could also see its evolution over time and how the atmosphere interacts with that evolution! There is much work to go in analyzing these data, especially in comparing the many other instruments to our DopplerScatt measurements, but I am grateful to play a part in that analysis, discovery and understanding.”

– Alex Wineteer, NASA JPL DopplerScatt operator

Original Article

Continue Reading

NASA Selects New Mission to Study Storms, Impacts on Climate Models

NASA INCUS

NASA has selected a new Earth science mission that will study the behavior of tropical storms and thunderstorms, including their impacts on weather and climate models. The mission will be a collection of three SmallSats, flying in tight coordination, called Investigation of Convective Updrafts (INCUS), and is expected to launch in 2027 as part of NASA’s Earth Venture Program.
NASA selected INCUS through the agency’s Earth Venture Mission-3 (EVM-3) solicitation that sought complete, space-based investigations to address important science questions and produce data of societal relevance within the Earth science field. NASA received 12 proposals for EVM-3 missions in March 2021. After detailed review by panels of scientists and engineers, the agency selected INCUS to continue into development.

“Every one of our Earth science missions is carefully chosen to add to a robust portfolio of research about the planet we live on,” said Thomas Zurbuchen, associate administrator for the agency’s Science Mission Directorate in Washington. “INCUS fills an important niche to help us understand extreme weather and its impact on climate models – all of which serves to provide crucial information needed to mitigate weather and climate effects on our communities.”

INCUS aims to directly address why convective storms, heavy precipitation, and clouds occur exactly when and where they form. The investigation stems from the 2017 Earth Science Decadal Survey by the National Academies of Sciences, Engineering, and Medicine, which lays out ambitious, but critically necessary, research and observation guidance.

“In a changing climate, more accurate information about how storms develop and intensify can help improve weather models and our ability to predict risk of extreme weather,” said Karen St. Germain, NASA’s Earth Science division director. “This information not only deepens our scientific understanding about the changing Earth processes, but can help inform communities around the world.”

Climate change is increasing the heat in the oceans and making it more likely that storms will intensify more often and more quickly, a phenomenon NASA scientists continue to study.
Storms begin with rapidly rising water vapor and air that create towering clouds primed to produce rain, hail, and lighting. The greater the mass of water vapor and air that is transported upward in the atmosphere, the higher the risk of extreme weather. This vertical transport of air and water vapor, known as convective mass flux (CMF), remains one of the great unknowns in weather and climate. Systematic CMF measurements over the full range of conditions would improve the representation of storm intensity and constrain high cloud feedbacks – which can add uncertainty – in weather and climate models.

The principal investigator for INCUS is Susan van den Heever at Colorado State University in Fort Collins. The mission will be supported by several NASA centers including the Jet Propulsion Laboratory in Southern California, Goddard Space Flight Center in Greenbelt, Maryland, Marshall Space Flight Center in Huntsville, Alabama, with key satellite system components to be provided by Blue Canyon Technologies, and Tendeg LLC, both in Colorado. The mission will cost approximately $177 million, not including launch costs. NASA will select a launch provider in the future.

NASA’s Earth Venture Program consists of science-driven, competitively selected, low-cost missions/investigations. This program provides opportunities for investment in innovative science to enhance our capability to better understand the current state of the Earth system and further improve predictions of future changes. The current Earth Venture program include full missions, satellite instruments for flights of opportunity, instruments for Earth science data record continuity, and sustained suborbital investigations.

For more information about NASA’s Earth science programs, visit: https://www.nasa.gov/earth

Press Contacts
Tylar Greene
Headquarters, Washington
202-358-0030
tylar.j.greene@nasa.gov

Continue Reading

NASA’s TROPICS Pathfinder Satellite Produces Global First Light Images and Captures Hurricane Ida

NASA Tropics

On August 8, NASA’s TROPICS Pathfinder satellite captured global first light images as well as a look inside the structure of Hurricane Ida before and after it made landfall.

The satellite launched on June 30, 2021 as the pathfinder – or test – satellite for NASA’s Time-Resolved Observations of Precipitation structure and storm Intensity with a Constellation of Smallsats (TROPICS) mission. The Pathfinder satellite provides an opportunity to test the technology, communication systems, and data processing before the six satellites comprising the TROPICS constellation launch in 2022. “[Pathfinder] is like a dress rehearsal of the mission,” said Bill Blackwell, the principal investigator for the TROPICS mission and a researcher at the Massachusetts Institute of Technology Lincoln Laboratory in Lexington, Massachusetts.

The future TROPICS constellation will orbit Earth in three planes, collecting temperature, water vapor, precipitation, and cloud ice measurements on a frequent, near-global scale to study storms and other meteorological events. The idea is that multiple satellites in spread out orbits will collect more frequent measurements around the globe, allowing scientists to study storms as they develop and then use the newly-acquired knowledge to improve forecasting capabilities. The TROPICS research team includes researchers from NASA, the National Oceanic and Atmospheric Administration (NOAA), and several universities and commercial partners.

“Early in the mission, the Pathfinder satellite has already demonstrated the usefulness of this data – especially the images of Hurricane Ida. We’re able to see a lot of features that we want to study with the TROPICS constellation,” said Blackwell.

NASA Tropics

Three images produced by the TROPICS Pathfinder satellite using different frequencies.
The TROPICS Pathfinder satellite captured its first global data on August 8, 2021, including a channel around 205 GHz (top). It’s the first time a frequency higher than 190 GHz has been used on a space-borne microwave cross-track sounder instrument, which collects temperature and water vapor data using microwave radiance observations.
Credits: NASA / TROPICS Pathfinder satellite

The global first light images show microwave data collected at several frequencies, each giving scientists a different piece of the larger puzzle of thermodynamics in Earth’s atmosphere. The image, comprised of 91 GHz data, shows water vapor, including swirls of atmospheric moisture over the ocean. The data from the 115 GHz frequency provides measurements of temperature at Earth’s surface and in the lower atmosphere. The 205 GHz data yields measurements of the precipitation-sized ice particles contained within clouds. “This is the first time we’ve flown a microwave cross-track sounder using that high of a frequency,” said Blackwell. The microwave cross-track sounder is an instrument that collects temperature and water vapor data using microwave radiance observations. “It’s very sensitive to observe ice in the cloud tops, which can give us an indication of the intensity of a storm.”

TROPICS Pathfinder also captured images of Hurricane Ida on August 28 and 29, just before and after the storm made landfall in Louisiana. Read the full story about these images on the NASA Applied Sciences website.

NASA Tropics

Images of Hurricane Ida before landfall (left) show a well-defined eye of the storm, as well as inner and outer rainbands that persisted as the storm made landfall in Louisiana (right).
Credits: NASA / TROPICS Pathfinder satellite

“What the constellation will give us that we don’t have today is higher revisit rates – so we’ll be able to observe storms from space at microwave frequencies much more frequently than we can now,” said Blackwell.

By Sofie Bates
NASA’s Earth Science News Team
Link to original article NASA’s TROPICS Pathfinder Satellite Produces Global First Light Images and Captures Hurricane Ida

Continue Reading

Pathfinder Satellite Paves Way for Constellation of Tropical-storm Observers

The 2020 Atlantic hurricane season was one of the most brutal on record, producing an unprecedented 30 named storms. What’s more, a record-tying 10 of those storms were characterized as rapidly intensifying — some throttling up by 100 miles per hour in under two days.

To bring more data to forecasters and have a more consistent watch over Earth’s tropical belt where these storms form, NASA has launched a test satellite, or pathfinder, ahead of a constellation of six weather satellites called TROPICS (Time-Resolved Observations of Precipitation structure and storm Intensity with a Constellation of Smallsats). Planned for launch in 2022, the TROPICS satellites will work together to provide near-hourly microwave observations of a storm’s precipitation, temperature, and humidity – a revisit time for these measurements not currently possible with other satellites.

“As a lifelong Floridian, I’ve seen firsthand the devastating impact that hurricanes can have on our communities. And as climate change is making hurricanes even stronger, it’s more important than ever that NASA and our partners invest in missions like TROPICS to better track and understand extreme weather,” said NASA Administrator Bill Nelson. “NASA’s innovation is strengthening data models that help scientists improve storm forecasting and understand the factors that feed these monster storms. TROPICS will help to do just that and we look forward to next year’s launch of the TROPICS satellite constellation.”

When launched, the TROPICS satellites will work together to provide near-hourly microwave observations of a storm’s precipitation, temperature, and humidity. The mission is expected to help scientists understand the factors driving tropical cyclone intensification and to improve forecasting models.Credits: NASA

“TROPICS is the beginning of a new era. This mission will be among the first to use a constellation of small satellites for these types of global, rapid-revisit views of tropical storms,” said Scott Braun, the TROPICS project scientist and a research meteorologist at NASA’s Goddard Space Flight Center in Greenbelt, Maryland.

Since tropical cyclones and hurricanes can change rapidly as they travel across the ocean, the increased observations from the TROPICS satellites will not only advance the science of understanding storm intensity, they also may improve intensity forecasts.

“The project holds great promise to boost NOAA’s steady improvements in weather and hurricane forecasts by feeding new environmental data into our world-class numerical weather prediction models,” said Frank Marks, director of the Hurricane Research Division of NOAA’s Atlantic Oceanographic and Meteorological Laboratory. After all six satellites are launched and positioned in 2022, “this new constellation will provide high frequency temperature and humidity soundings as we seek to learn how hurricanes interact with the surrounding temperature and moisture environment—key data that could improve hurricane intensity forecasts.”

A critical step to preparing for the constellation is the launch of a pathfinder satellite, a seventh identical copy of the TROPICS smallsats, that will enable full testing of the technology, communication systems, data processing, and data flow to application users in advance of the constellation’s launch. This will allow time for adjustments to the ground system and data products, helping ensure the success of the TROPICS mission.

“The TROPICS Pathfinder satellite is similar to a screening before the opening night of a big show,” said Nicholas Zorn, the Pathfinder program manager from MIT Lincoln Laboratory. “Its mission is a real-world, end-to-end test, from environmental verification through integration, launch, ground communications, commissioning, calibration, operations, and science data processing. Any areas for improvement identified along the way can be reinforced before the constellation launches.”


The TROPICS Pathfinder satellite, pictured above, was launched on June 30. The satellite body measures approximately 10 cm X 10 cm X 36 cm and is identical to the six additional satellites that will be launched in the constellation in 2022. The golden cube at the top is the microwave radiometer, which measures the precipitation, temperature, and humidity inside tropical storms.
Credits: Blue Canyon Technologies

MIT Lincoln Laboratory’s William Blackwell is the TROPICS principal investigator. Six years ago, he submitted TROPICS as a proposal to NASA’s Earth Venture Instrument competition series and was awarded funding. The Earth Venture Instrument program calls for innovative, science-driven, cost-effective missions to solve pressing issues related to Earth science.

Aboard each TROPICS small satellite is an instrument called a microwave radiometer, which detects temperature, moisture, and rainfall in the atmosphere. On current weather satellites, microwave radiometers are about the size of a washing machine. On TROPICS’ small satellites the radiometers are about the size of a coffee mug.

Microwave radiometers work by detecting the thermal radiation naturally emitted by oxygen and water vapor in the air. The TROPICS instrument measures these emissions via an antenna spinning at one end of the satellite. The antenna listens in at 12 microwave channels between 90 to 205 gigahertz, where the relevant emission signals are strongest. These channels capture signals at different heights throughout the lowest layer of the atmosphere, or troposphere, where most weather we experience occurs.

By flying the TROPICS radiometers at lower altitude and detecting fewer channels than their larger counterparts, in the channels they do carry, the radiometers deliver comparable performance.

Miniaturizing the microwave radiometer has been an incremental process over the last 10 years for Blackwell and his team, spurred by the invention of CubeSats, satellites the size of a loaf of bread that are often economical to launch. TROPICS builds on Blackwell and his team’s 2018 success in launching the first microwave radiometer on a CubeSat to collect atmospheric profiling data. The instrument aboard the TROPICS’ six satellites has been upgraded to provide improved sensitivity, resolution and reliability and will make more targeted and rapid weather observations.

“These storms affect a lot of people, and we expect that with the increased observations over a single storm from TROPICS, we will be able to improve forecasts, which translates to helping people get to safety sooner, protect property, and overall enhance the national economy,” Blackwell says, looking ahead to the full constellation launch next year. “It is amazing technology that we have proven out that allows us to maximize the science from the instrument’s size factor. To pull this off has taken contributions of so many people.”

The TROPICS science team includes researchers from MIT Lincoln Laboratory and MIT Department of Aeronautics and Astronautics; NASA’s Goddard Space Flight Center; NOAA Atlantic Oceanographic and Meteorological Laboratory; NOAA National Hurricane Center; NOAA National Environmental Satellite, Data, and Information Service; University of Miami; Colorado State University; Vanderbilt University; and University of Wisconsin. The University of Massachusetts Amherst, Texas A&M University and Tufts University contributed to the technology development. Maverick Space Systems provided integration services for the Pathfinder, which was launched from SpaceX’s Transporter 2 mission. Astra Space Inc. is providing launch services for the constellation. NASA’s Launch Services Program based at Kennedy Space Center procured and is managing the Tropics Pathfinder launch service.

By Kylie Foy
Massachusetts Institute of Technology, Lincoln Laboratory

NASA Media Contact: Ellen Gray, Earth Science News Team

Original Article

Continue Reading

TEMPO Air Pollution Sensor Treks Toward Satellite Integration

Tempo Ship Out

A crew at Ball Aerospace in Broomfield, Colorado, rolls the TEMPO satellite instrument onto a truck for shipment to Maxar Technologies’ satellite manufacturing facility in Palo Alto, California.
Credits: Ball Aerospace

A NASA satellite instrument that will measure air pollution over North America has reached another key project milestone. On Tuesday, May 18, The Tropospheric Emissions: Monitoring of Pollution (TEMPO), instrument, which will take hourly daytime measurements at an unprecedented spatial resolution shipped from Ball Aerospace in Broomfield, Colorado, to Maxar Technologies’ satellite manufacturing facility in Palo Alto, California, for integration onto the Intelsat 40e.

Ball completed building TEMPO in 2018. After its scheduled launch in 2022, the TEMPO instrument will make measurements of air pollution —including ozone, nitrogen dioxide and formaldehyde, and tiny atmospheric particles called aerosols — that can damage human health and the environment. Those measurements will reach from Puerto Rico and Mexico to northern Canada, and from the Atlantic to the Pacific, encompassing the entire lower 48 United States.

“This is an exciting time for the mission,” said Kevin Daugherty, TEMPO project manager at NASA’s Langley Research Center in Hampton, Virginia. “We are about to begin integrating the TEMPO instrument with our host satellite and undergo testing to ensure the satellite can survive the launch and environment of space prior to being launched into space.”

From its geostationary orbit — a high Earth orbit that allows satellites to match Earth’s rotation — TEMPO will also form part of an air quality satellite “virtual constellation” that will track pollution around the Northern Hemisphere. South Korea’s Geostationary Environment Monitoring Spectrometer (GEMS), the first instrument in the constellation, launched into space last year on the Korean Aerospace Research Institute GEO-KOMPSAT-2B satellite, and is measuring pollution over Asia. The European Space Agency Sentinel-4 satellite, expected to launch in 2023, will make measurements over Europe and North Africa.

Kelly Chance, of the Smithsonian Astrophysical Observatory in Cambridge, Massachusetts, is the principal investigator for TEMPO.

— NASA Langley Research Center

Credit: Joe Atkinson
link to original article TEMPO Air Pollution Sensor Treks Toward Satellite Integration

Continue Reading

NASA’s S-MODE Takes to the Air and Sea to Study Ocean Eddies

NASA's S-MODE

After being delayed over a year due to the pandemic, a NASA field campaign to study the role of small-scale whirlpools and ocean currents in climate change is taking flight and taking to the seas in May 2021.

Using scientific instruments aboard a self-propelled ocean glider and several airplanes, this first deployment of the Sub-Mesoscale Ocean Dynamics Experiment (S-MODE) mission will deploy its suite of water- and air-borne instruments to ensure that they work together to show what’s happening just below the ocean’s surface. The full-fledged field campaign will begin in October 2021, with the aircraft based out of NASA’s Ames Research Center in Mountain View, California.

“This campaign in May is largely to compare different ways of measuring ocean surface currents so that we can have confidence in those measurements when we get to the pilot in October,” said Tom Farrar, associate scientist at the Woods Hole Oceanographic Institution in Massachusetts and principal investigator for S-MODE.

The S-MODE team hopes to learn more about small-scale movements of ocean water such as eddies. These whirlpools span about 6.2 miles or ten kilometers, slowly moving ocean water in a swirling pattern. Scientists think that these eddies play an important role in moving heat from the surface to the ocean layers below, and vice versa. In addition, the eddies may play a role in the exchange of heat, gases and nutrients between the ocean and Earth’s atmosphere. Understanding these small-scale eddies will help scientists better understand how Earth’s oceans slow down global climate change.


Sub-mesoscale ocean dynamics, like eddies and small currents, are responsible for the swirling pattern of these phytoplankton blooms (shown in green and light blue) in the South Atlantic Ocean on Jan. 5, 2021.
Credits: NASA’s Goddard Space Flight Center Ocean Color, using data from the NOAA-20 satellite and the joint NASA-NOAA Suomi NPP satellite.

A Self-Powered Surfboard, for Science!

The team is using a self-propelled commercial Wave Glider decked out with scientific instruments that can study the ocean from its surface. The most important gadgets aboard are the acoustic Doppler current profilers, which use sonar to measure water speed and gather information about the how fast the currents and eddies are moving, and in which direction. The glider also carries instruments to measure wind speed, air temperature and humidity, water temperature and salinity, and light and infrared radiation from the Sun.

“The wave glider looks like a surfboard with a big venetian blind under it,” said Farrar.

That “venetian blind” is submerged under the water, moving up and down with the ocean’s waves to propel the glider forward at about one mile per hour. In this way, the wave glider will be deployed from La Jolla, California, collecting data as it travels over 62 miles (100 kilometers) out into the ocean offshore of Santa Catalina Island.
Decked out with solar panels and several scientific instruments, the wave glider will propel itself from Santa Catalina Island farther out to sea.

Laurent Grare of the Scripps Institution of Oceanography prepares to recover a Wave Glider during a pre-deployment test. Decked out with solar panels and several scientific instruments, the wave glider will propel itself from Santa Catalina Island farther out to sea.
Credits: Courtesy of Benjamin Greenwood / Woods Hole Oceanographic Institution

The new data will allow the scientists to estimate the exchange of heat and gases between Earth’s atmosphere and the ocean, and consequently better understand global climate change.

“We know the atmosphere is heating up. We know the winds are speeding up. But we don’t really understand where all that energy is going,” said Ernesto Rodriguez, research fellow at NASA’s Jet Propulsion Laboratory in Pasadena, California, and deputy principal investigator for the airborne parts of S-MODE. It’s likely that this energy is going into the ocean, but the details of how that process works are still unknown. The team thinks that small-scale eddies may help move heat from the atmosphere to the deeper layers of the ocean.
Eyes and Scientific Instruments in the Skies

While the Wave Glider continues its slow trek across the ocean’s surface, several airplanes will fly overhead to collect data from a different vantage.

“In an airplane, we can get a snapshot of a large area to see the context of how the bigger- and smaller-scale ocean movements interact,” said Rodriguez.

For example, a ship or wave glider travels slowly along a straight line, taking precise measurements of sea surface temperature at specific times and places. Airplanes move faster and can cover more ground, measuring the sea surface temperature of a large swath of ocean very quickly.

“It’s like taking an infrared image rather than using a thermometer,” explained Farrar.


A flight crew prepares for the B200 King Air Sub-Mesoscale Ocean Dynamics Experiment (S-MODE) at NASA’s Armstrong Flight Research Center in Edwards, California. From left to right are Jeroen Molemaker and Scott “Jelly” Howe.

Two planes will be used in the May test flights: a B200 plane from NASA’s Armstrong Flight Center in Edwards, California and a commercial plane from Twin Otter International. The B200 is carrying an instrument from NASA JPL called DopplerScatt to measure currents and winds near the ocean surface with radar. The Multiscale Observing System of the Ocean Surface (MOSES) instrument from the University of California, Los Angeles is also aboard to collect sea surface temperature data. On the Twin Otter plane is the Modular Aerial Sensing System (MASS) from the Scripps Institution of Oceanography at the University of California, San Diego, which is an instrument capable of measuring the height of waves on the surface of the ocean.


Delphine Hypolite, Multiscale Observing System of the Ocean Surface (MOSES) Operator from University of California Los Angeles, performs pre-flight checks on the MOSES Camera System at NASA’s Armstrong Flight Research Center in Edwards, California.

The fleet will gain a third member for the October experiments: NASA’s Langley Research Center Gulfstream III plane with JPL’s Portable Remote Imaging SpectroMeter (PRISM), an instrument to measure phytoplankton and other biological material in the water. The October deployments will also use a large ship and some autonomous sailing vessels, called Saildrones, in addition to planes and Wave Gliders.

After nearly a year and a half of delays due to the pandemic, the S-MODE team is excited to get their planes in the sky and the gliders in the water. “It was frustrating,” Rodriguez said, “but the science team hasn’t slowed down. The science keeps progressing.”

S-MODE is NASA’s ocean physics Earth Venture Suborbital-3 (EVS-3) mission, funded by the Earth System Science Pathfinder (ESSP) Program Office at NASA’s Langley Research Center in Hampton, Virginia, and managed by the Earth Science Project Office (ESPO) at Ames Research Center.

By Sofie Bates
NASA’s Earth Science News Team
Last Updated: May 19, 2021
Editor: Sofie Bates

Re-Posted from 0riginal Article

Continue Reading

Earth Day Connections: NASA Investigates Vegetation

vegetation change

From the vantage point of space, NASA’s fleet of Earth-observing satellites joins with those of partner interagency and international agencies to investigate and illuminate connections between ecosystems that are continents apart, or right next door. With a global perspective, scientists can observe how factors like deforestation, climate change and disasters impact forests and other plant life – while also studying how changes in vegetation impact air quality, waterways and the climate. Vegetation is the primary energy source for nearly all life on Earth, so monitoring it and forecasting how it could be impacted by climate change is key.

In the Amazon, NASA Earth scientists monitor forests and bring these data into the hands of local decision-makers. NASA data provides information about the clearing of trees for agriculture and ranching as well as the impacts of drought on tree mortality. People cut down forests and then ignite the piles of trees and other vegetation, leading to wildfires, which can be detected by instruments including the thermal imager on the Suomi NPP satellite. In 2020, these sensors detected where 1.4 million fires took place. The fires generate smoke that can drift over the continent and be seen from space.

With instruments that collect images of Earth’s surface, researchers can also track the scale of those fires and forest clearings over the years, and even over decades. With the joint NASA/U.S. Geological Survey’s Landsat mission, which launched its first satellite in 1972 and is scheduled to launch Landsat 9 in September 2021, scientists can track changing patterns of deforestation that tells them how Amazonian agricultural practices have changed, from small family holdings to massive ranching operations.

Tracking Plant Health from Space

Satellites can detect how “green” an area is – showing the health of plants that are growing in a particular site. While fires, deforestation and drought lead to the tropical Amazon being less green, warming temperatures in the Arctic lead to tundra and boreal regions becoming greener. Using 87,000 Landsat images spanning nearly three decades, scientists found that a third of the land cover of Canada and Alaska looked different in 2012 as compared to 1985. With warmer temperatures, and longer growing seasons, shrubs become denser on grassy tundras, transforming what they looked like from space.

Since plants take up carbon dioxide from the air as they undergo photosynthesis to make food, it may seem that having a greener Arctic would a result in less of the greenhouse gas in the atmosphere. However, a recent study using satellite data and computer models found that any increased carbon uptake in the Arctic is offset by a decline in the tropics. There, warmer global temperatures have led to a drier atmosphere. That means less rainfall and more drought in places like the Amazon, which leads to a drop in tree growth and increases in tree mortality – and less carbon taken from the atmosphere. Soon, water availability could limit the amount of greening in the Arctic as well, the scientists found. As forests expand or are cut back, researchers use data from instruments including MODIS and satellites like Landsat to measure their extent and health.

A new suite of NASA instruments in space also measure the health of forests. The Global Ecosystem Dynamics Investigation – or GEDI – instrument aboard the International Space Station uses lasers to measure the height of trees, allowing researchers to investigate how ecosystems are changing and how the carbon and water cycles are shifting in a warming climate. The Ice, Cloud and land Elevation Satellite 2, or ICESat-2, uses a similar technique to measure heights, and can reach higher latitudes to see changes in the Arctic biomes as well. And the Ecosystem Spaceborne Thermal Radiometer Experiment on Space Station, or ECOSTRESS, measures the temperature of plants, to help determine their water consumption and health.

From Forests to Farms

While climate change impacts the growth and health of vegetation, naturally occurring weather patterns have an impact as well. Scientists with NASA Harvest are looking into the connections between El Niño/La Niña weather patterns, and the farming conditions and crop yields in eastern and southern Africa. During El Niño years, winds and currents in the equatorial Pacific Ocean cause water to pile up against South America, impacting weather patterns around the globe – even in Africa. Researchers found that southern Africa tends to have decreased crop yields during El Niño phases, while eastern Africa sees increased crop yields in those years – knowing these relationships can help farmers and policy makers prepare for a given season.

NASA satellites and science also help farmers in the United States monitor and track their crops. Having more information about rainfall, plant health and other data gives farmers information they use to deal with the extreme weather events that are increasing due to climate change, as well as shifting planting zones and other effects like early freezes and heavier spring rains. The U.S. Department of Agriculture estimates and tracks crop production using farmer surveys and ground observations, with a big-picture assist from Landsat data, NASA computer models and other Earth science resources. They also use MODIS instruments to monitor daily vegetation health – all to help determine what the crop yield will be, and which areas could be facing problems.

These same satellites can also help scientists track the unwanted products of some agricultural fields, including runoff that flows into waterways. Farms, forests, tundra – all these vegetated ecosystems connect to other spheres of our home planet.

By Kate Ramsayer
NASA’s Goddard Space Flight Center, Greenbelt, Md.

Reposted from original article

Continue Reading

Disappearing Deltas: The Delta-X Airborne Mission Investigates

NASA researchers are using high resolution airborne data to determine the vulnerability and resilience of the Mississippi River Delta.


Cynthia Hall, NASA ESDS Program Community Coordinator

Many of the world’s large deltas are in peril due to coastal land subsidence and sea level rise. The Mississippi River Delta is one of these disappearing systems; it’s the world’s seventh largest delta and is a living laboratory where scientists can gather data to learn how to save these valuable ecosystems and the services they provide.

Series of false-color satellite images chronicles the growth of the two deltas between 1984 and 2017. All of the images were acquired by instruments on Landsat satellites. Credit: NASA Earth Observatory

This series of false-color satellite images chronicles the growth of the Wax Lake Outlet Delta (upper feature) and the Atchafalaya River Delta (lower feature) in Louisiana between 1984 and 2017 where they empty into the Gulf of Mexico. All of the images were acquired by instruments aboard the joint NASA/USGS Landsat series of satellites. Credit: NASA Earth Observatory.

On average there is one delta for every 300 km of shoreline around the world. As rivers meet the ocean, slowing down and fanning out, sediments are dropped, forming a delta. Coastal waves, river discharge, vegetation, and tidal water flow all influence the development of deltas. Coastal communities rely on deltaic environments for many reasons and their disappearance can have catastrophic effects. Deltas serve as a buffer for storm surges, thereby protecting mainland areas; they serve as nurseries for a variety of marine organisms; they sustain and provide sustenance for biologically diverse ecosystems; and their soil serves as a filter that removes toxins from the water. The loss of a delta to subsidence and sea level rise would result in numerous environmental, economic, and social impacts on coastal communities.

The Mississippi River Delta is a unique testbed in that it is sinking in some areas, like the Terrebonne Basin, but growing in adjacent areas, like the Atchafalaya Basin to the west. The Terrebonne Basin is engineered (marked by channelization and levees), and this has decreased sediment flow to the delta floodplain. Large parts of the Atchafalaya Basin, conversely, allow rivers to deliver sediment to that basin. According to Delta-X principal investigator (PI) Dr. Marc Simard and co-PI Dr. Cathleen Jones at NASA’s Jet Propulsion Laboratory in Pasadena, CA, the Mississippi River Delta offers the unique opportunity to investigate areas with similar vegetation and climate, but very different soil accretion patterns. Understanding delta formation in an environment like the Mississippi River Delta, that is experiencing both erosion and accretion, is important because the U.S. Gulf Coast is experiencing some of the highest levels of global sea level rise: between 9 to 12 mm per year, which is three-to-four times the global average.

The Investigation

Delta-X Logo

NASA’s Delta-X airborne mission, with flights that began on March 26, 2021, is gathering remotely sensed and in situ data to study changes occurring to the water, vegetation, and sediment along the Atchafalaya and Terrebonne Basins. The data will be assimilated into a model to forecast the resilience and vulnerability of the delta given the rising seas; the framework for the model can be used for forecasting change in other delta systems around the world. Delta-X was competitively selected through NASA’s Earth Venture Suborbital-3 program.

Delta-X uses three primary airborne sensors: the Airborne Visible-Infrared Imaging Spectrometer-Next Generation (AVIRIS-NG), an instrument with high spectral resolution at visible wavelengths; the Air Surface Water and Ocean Topography (AirSWOT) instrument suite, which includes a Ka-band synthetic aperture radar (SAR); and the Uninhabited Aerial Vehicle Synthetic Aperture Radar (UAVSAR), which collects data in the L-band. Wavelength is an important feature to consider when working with SAR since the wavelength determines how the radar signal interacts with the surface and how far the signal penetrates into a medium. The Ka-band represents a shorter wavelength and is able to measure highly reflective rough water surfaces with little to no vegetation, whereas the longer wavelength L-band can penetrate more heavily vegetated areas to measure changes in the water surface below vegetation.

For more information on sensors and spectral resolution, see the Earthdata Backgrounders What is Remote Sensing and What is Synthetic Aperture Radar.

These airborne instruments collect data more frequently than satellites in order to detect changes to water levels and sediment concentration over a full tidal cycle (the Gulf Coast experiences diurnal tides, meaning one high and one low tide per day). The data will be collected concurrently on three different aircraft, while scientists in the field collect in situ data at the same time. This facilitates multi-scale and multi-instrument calibration of models. These models will be used to validate upcoming satellite missions like the Surface Water and Ocean Topography (SWOT) and the NASA/Indian Space Research Organization (ISRO) Synthetic Aperture Radar (NISAR) missions. These missions will not have the ability to make multiple measurements during a single tidal cycle, however. SWOT will obtain measurements over a given area every 21 days and NISAR every 12 days.

Delta-X makes breakthrough advances in the study of deltaic evolution, moving beyond coarse areal averaging to resolve mesoscale features. Click on image for larger view. Credit: NASA's Jet Propulsion Laboratory.

Delta-X makes breakthrough advances in the study of deltaic evolution, moving beyond coarse areal averaging to resolve mesoscale features. Click on image for larger view. Credit: NASA’s Jet Propulsion Laboratory.

The data from Delta-X will be used to calibrate and validate a series of dynamic, hydroecological models, which can then be used to forecast the future of the Mississippi River Delta. Delta formation models before AirSWOT were developed at a coarse scale. Delta-X co-PI Jones equates this to a bathtub view, in which you are looking at the entire deltaic system (macroscale). To more accurately predict the resilience of the delta and inform realistic remediation plans, measurements at a smaller, or mesoscale (around one hectare [10,000 m2] or roughly the size of a sports field), are needed. To make better predictions about delta formation, scientists need to be able to define channels, surface water levels and discharge, sediment movement, and plant production at a much finer resolution than coarse areal averages.

The UAVSAR data will create maps of water level changes in wetlands over time; AirSWOT data will provide water surface elevation measurements over the same time period, but within channels and lakes. These measurements help with understanding river discharge and sediment transport across the floodplain’s wetlands. There are two processes which contribute to soil accretion: delivery of sediments and plant production of organic material (i.e. roots and litter). AVIRIS-NG will be used to estimate the quantity of sediment being transported in the rivers and also to estimate plant structure, including species, biomass, and spatial distribution. This information will be incorporated into a model that simulates how the delta evolves.

Left image: Vegetation classification of the Atchafalaya Basin, LA, Right image: Map of water level changes based on water surface elevations measured by UAVSAR

Left image: Vegetation classification of the Atchafalaya Basin, LA, using data acquired from the AVIRIS-NG sensor, 2016. Credit: Jensen, D.J., Simard, M., Twilley, R., Castaneda, E. & McCall, A. 2020. NASA’s ORNL DAAC (DOI: 10.3334/ORNLDAAC/1821). Right image: Map of water level changes based on water surface elevations measured by UAVSAR on October 16, 2016, at 14:08 and 16:37 UTC. Credit: Jones, C., Simard, M. & Lou, Y. 2020. NASA’s ORNL DAAC (DOI: 10.3334/ORNLDAAC/1823).

All of these variables help scientists better understand the processes contributing to soil accretion, which is what is needed to save these critical geomorphic systems. Changing variables within the model will provide scientists with insight as to how the delta will respond under different circumstances.

The models based on Delta-X data, once developed and calibrated, determine how much sediment will need to be put back into the system sustainably, that is, in the most natural way possible, to mitigate the impacts of a rising sea. Jones notes, “…deltas are really sensitive. They live in this balance between losing and gaining land. But if we understand all the processes developed over millennia that have kept them in balance, we will be able to reverse some of the [loss].” The Delta-X modeling framework can be used for forecasting change in other delta systems around the world by using its remote sensing and numerical model parameters.

The Application

Model output showing particle flow from the Wax Lake Delta

Model output showing particle flow from the Wax Lake Delta. Developed through a Python package from Hariharan, J., Wright, K. & Passalacqua, P. (2020). “dorado: A Python package for simulating passive particle transport in shallow-water flows.” Journal of Open Source Software, 5(54): 2585 [DOI: 10.21105/joss]. Credit: NASA’s Jet Propulsion Laboratory.

The state of Louisiana has a $50 billion, 50-year plan to protect its coastline from erosion and rising sea levels. Data from Delta-X could help better inform coastal restoration efforts and sediment diversions.

According to Delta-X co-PI Simard, “In terms of application, Delta-X is very important; there is a science component of course, but application-wise we are really hoping it’s going to support decision making . . . to inform the state [of Louisiana] about remediation plans.” In fact, the Delta-X team has been interfacing with Louisiana’s Coastal Protection and Restoration Authority and the non-profit Water Institute of the Gulf in Baton Rouge to help develop sustainable coastal restoration efforts. In addition, 12 co-investigators from eight institutions, along with undergraduate, graduate, and postdoctoral students, have been involved in mission planning and will be working tirelessly in the coming months to understand this fragile ecosystem.

While the data and models from Delta-X are specifically for the Mississippi River Delta, Simard notes that, “the framework can be applied [to other deltas]. We can either take the model parameter values obtained during Delta-X to implement models elsewhere or, even better, we can have another Delta-X campaign over those other deltas to do a better job there too.”
Data Availability

To demonstrate the viability of the mission, two pre-Delta-X missions were conducted in 2015 and 2016. The data from these campaigns are archived at NASA’s Oak Ridge National Laboratory Distributed Active Archive Center (ORNL DAAC) and can be accessed at the links below:

Pre-Delta-X data in Earthdata Search
Pre-Delta-X data at ORNL DAAC

Delta-X data are expected to be available through Earthdata Search and ORNL DAAC in the fall of 2022. To keep up to date on the Delta-X campaign, read the Delta-X Science Blog.

Original Article Published April 12, 2021

Continue Reading

ACTIVATE Begins Year Two of Marine Cloud Study

NASA's ACTIVATE mission recently began its second year of flights. Here, final preparations are being made to the HU-25 Falcon prior to a flight.

A NASA airborne study has returned to the field for a second year of science flights to advance the accuracy of short- and long-term climate models.

The Aerosol Cloud meTeorology Interactions oVer the western ATlantic Experiment (ACTIVATE) began the third of six planned flight campaigns — two campaigns each year beginning in 2020 and ending in 2022 — in late January at NASA’s Langley Research Center in Hampton, Virginia.

Cloud formation in the atmosphere depends on the presence of tiny particles called aerosols. ACTIVATE scientists are working to understand how variations in these particles from human and natural sources affect low lying clouds over the ocean and how those clouds in turn affect the removal of these particles from the atmosphere.

Cloud feedback, or the absorption and reflection of solar energy by clouds, is one of the biggest remaining uncertainties in climate models. By unraveling some of the mysteries of the formation and evolution of clouds, ACTIVATE scientists will provide crucial data to reduce those uncertainties.

Researcher Luke Ziemba checks an instrument on the Falcon prior to a flight.

Luke Ziemba checks an instrument
Researcher Luke Ziemba checks an instrument on the Falcon prior to a flight.
Credits: NASA/David C. Bowman

The western North Atlantic Ocean is an ideal location for the study because it provides a wide range of weather conditions and receives a variety of aerosol types from sources such as the East Coast, the ocean and even wildfires from the West Coast — as researchers learned during the 2020 flights.

Cloud droplets can form on those aerosols and the first year of flight data revealed the broad range of cloud droplet number concentrations in this region of the Atlantic. These concentrations — not especially well represented in existing datasets — are a fundamental driver of the clouds themselves, and are thus key to understanding the multiple cloud types with varying properties based in the boundary layer area near the ocean’s surface. Data from the 2020 flights indicate that the outflow of North American pollution is a major source of aerosols activating into droplets, with a trend toward lower particle and drop concentrations with distance from the shore.

Also noteworthy from the 2020 flights was sampling in cold-air-outbreak conditions, where instrument data are currently being used to validate and improve models trying to better simulate development of associated clouds. Scientists believe the dry air causes aerosols near the ocean surface to change shape, which alters how they scatter light. The frequency and magnitude of these events was unexpected and affects how researchers use satellite measurements to retrieve information about the amount, type and properties of these aerosols.

HU-25 Falcon and King Air

HU-25 Falcon and King Air
The HU-25 Falcon and King Air on the tarmac prior to a flight. The aircraft fly in coordinated fashion — the Falcon flying through clouds taking measurements from the surrounding atmosphere, and the King Air flying at higher altitude taking both complementary remote sensing measurements from above and launching dropsondes to get important weather data.
Credits: NASA/David C. Bowman

To collect this data, the study employs two aircraft flying in coordinated fashion — an HU-25 Falcon flying through clouds taking measurements from the surrounding atmosphere and a King Air flying at higher altitude taking both complementary remote sensing measurements from above and launching dropsondes to get important weather data.

COVID-19 forced the ACTIVATE team to alter its 2020 flight schedule and push the second set of flights originally planned for the spring to late summer. With continued stringent safety protocols, ACTIVATE researchers hope to stick to their planned schedule in 2021, with the current flights lasting through March and a second set of flights in May and June.

“Our team did a remarkable job of persevering and staying focused under very challenging circumstances last year, and we aim to continue that momentum and focus into this next deployment,” said Armin Sorooshian, ACTIVATE principal investigator and atmospheric scientist at the University of Arizona. “If the 2021 flight data are anywhere near as intriguing in terms of the range of aerosol and meteorological conditions we observed in 2020, they’ll be extremely rich and build on an already large and valuable data archive for the international research community. Building statistics across a range of atmospheric variability is critical for better understanding of aerosol-cloud-meteorology interactions.”

ACTIVATE is one of five NASA Earth Venture Suborbital campaigns originally scheduled to take to the field in 2020. Three of the five were postponed in 2020 due to logistical and safety challenges posed by COVID-19. To learn more about the other campaigns, visit: https://www.nasa.gov/feature/goddard/2019/nasa-embarks-on-us-cross-country-expeditions

Joe Atkinson
NASA Langley Research Center


Read Full Article
*Source: NASA.gov

Continue Reading

Powered by WordPress. Designed by WooThemes