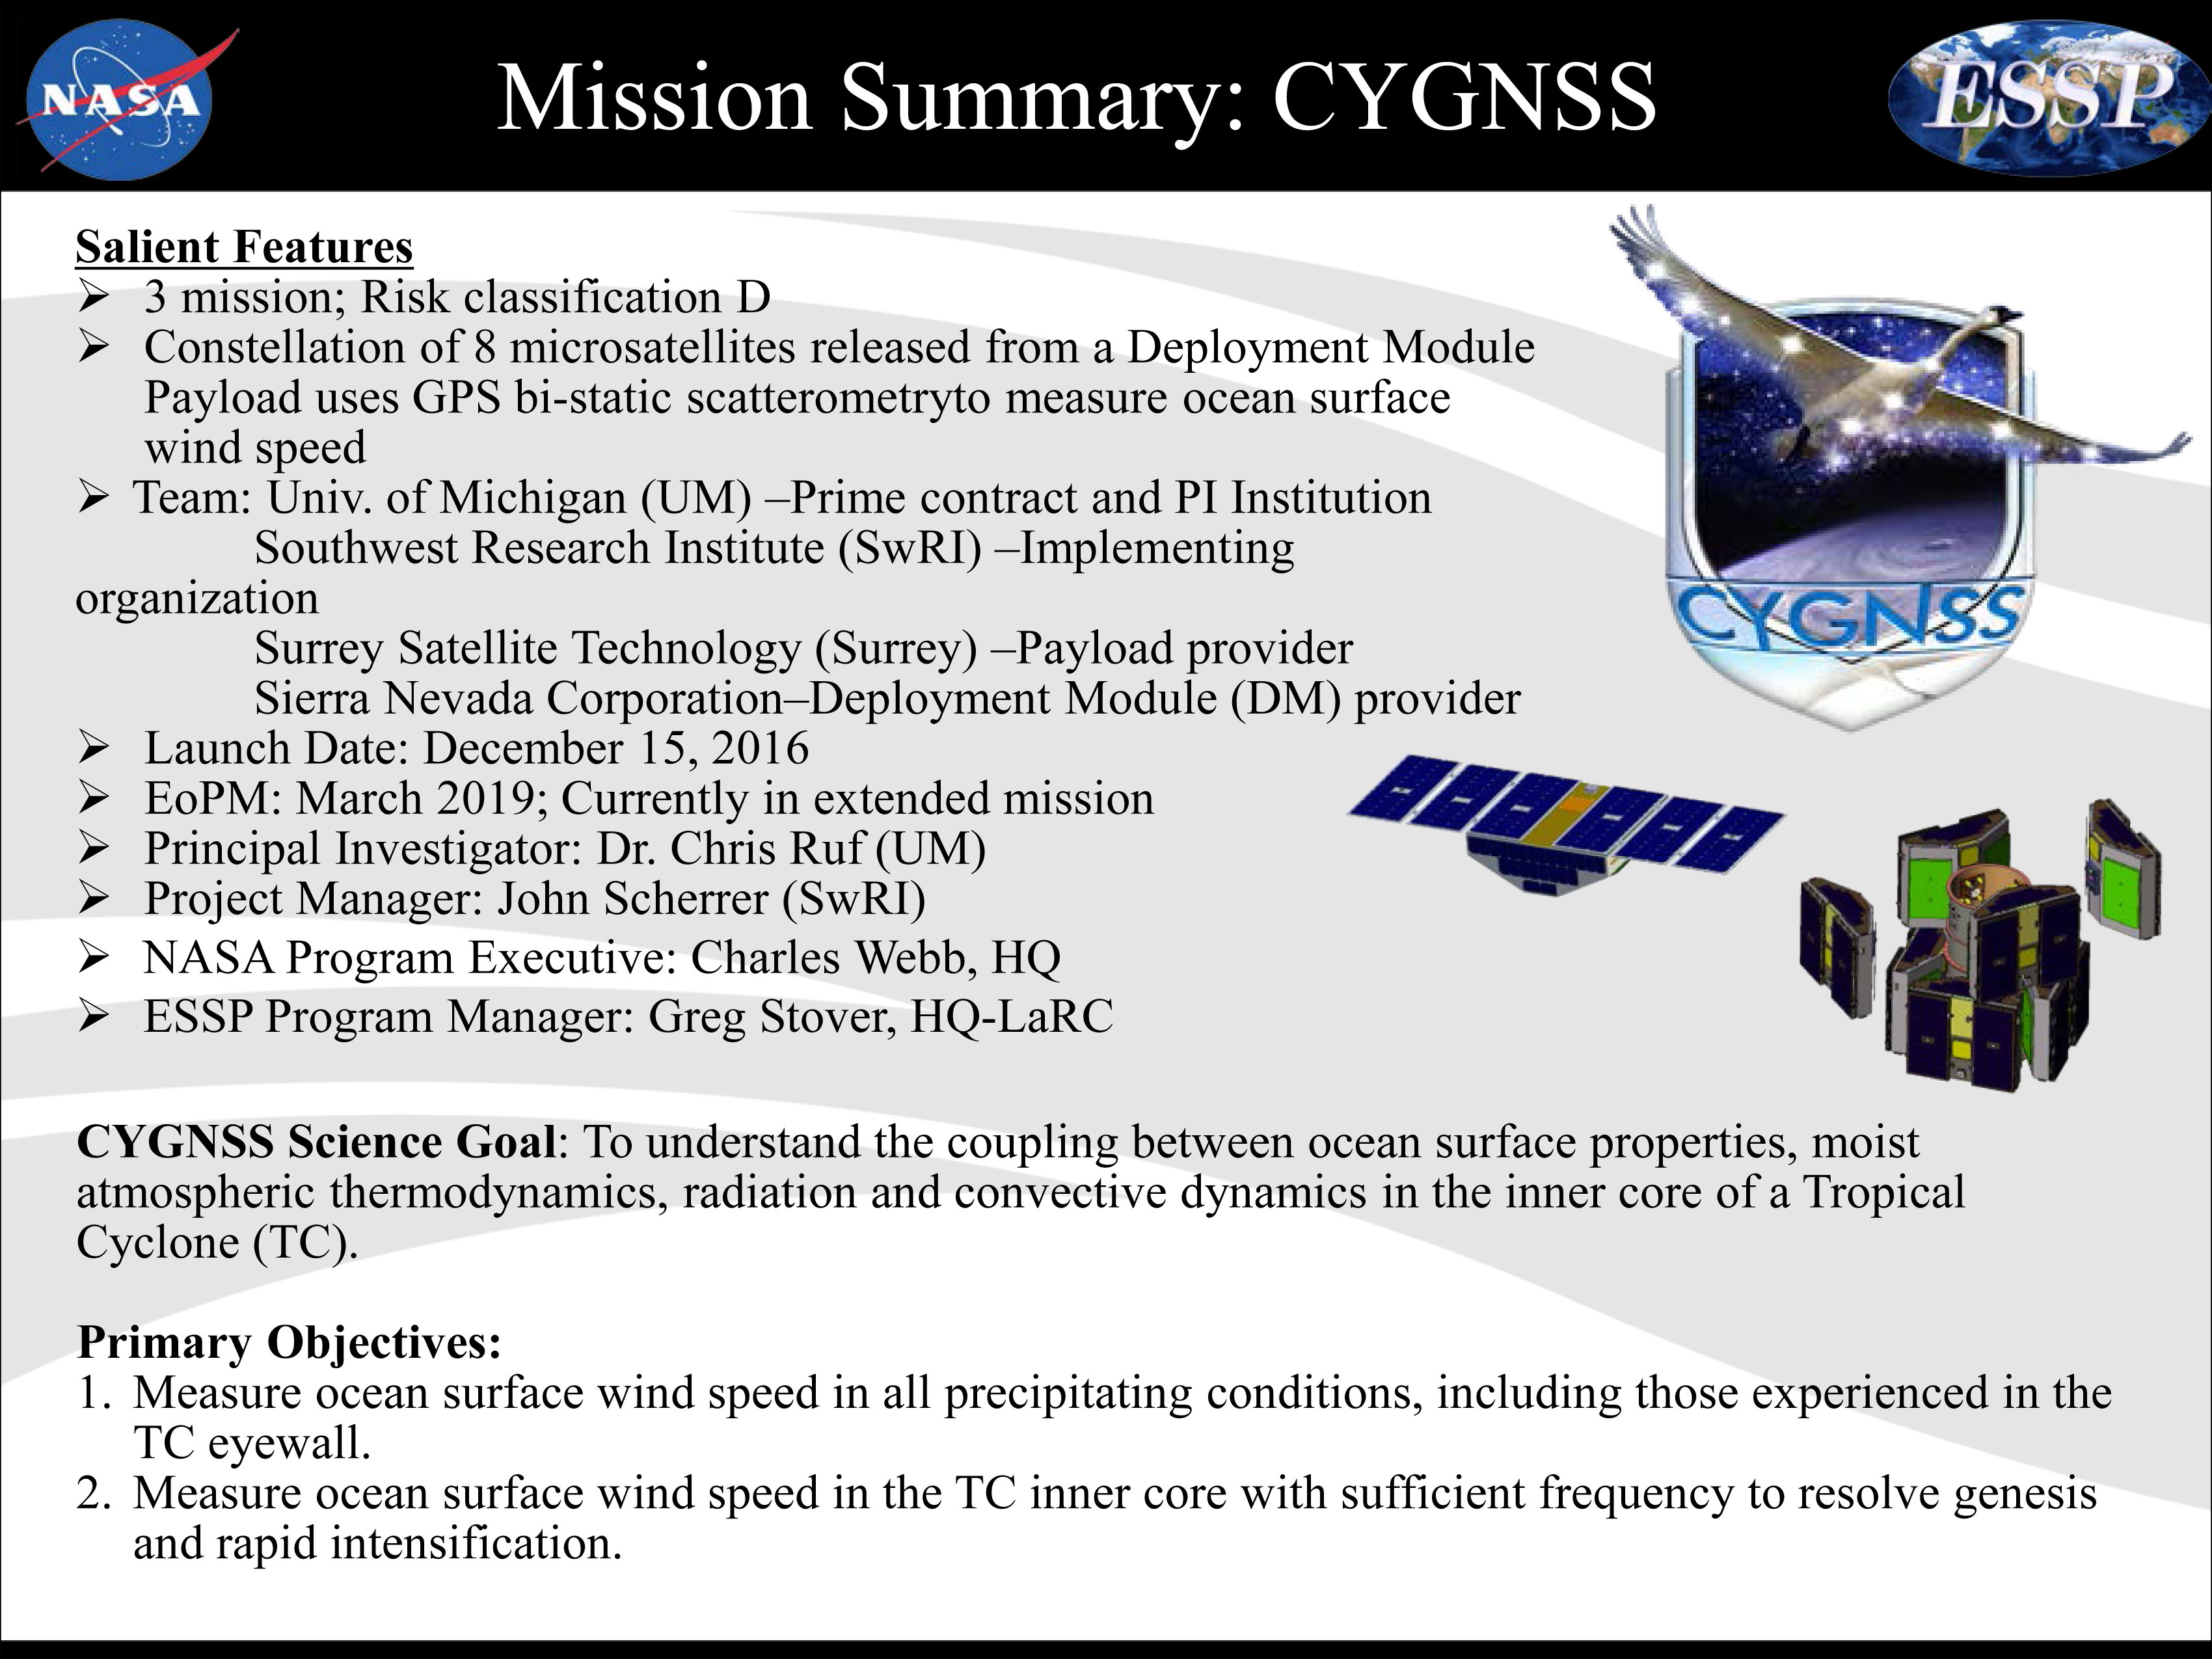
 Cyclone Global Navigation Satellite System (CYGNSS)
A new constellation in space is telling us how hurricanes and floods are threatening us on Earth
On December 15, 2016, an aircraft called “Stargazer” took off from Cape Canaveral, Florida and flew a hundred miles or so off the coast. During flight, a rocket was launched from the aircraft carrying eight NASA micro-satellites into space called Cyclone Global Navigation Satellite System (CYGNSS). The CYGNSS microsatellites are currently orbiting the tropics about 315 miles up. CYGNSS is used to measure winds in tropical storms and hurricanes. Since it can “see” the winds inside the storms and at the surface of the ocean, CYGNSS is able to improve predictions of how strong hurricanes will get and where they will make landfall. Not only is CYGNSS looking at the ocean, it is also studying moisture levels in the land. These soil moisture measurements can improve predictions of soil saturation, rain runoff and flooding. This data helps keep people who live in coastal areas safe from hurricane disasters and helps them plan better communities to combat future storms.
“It is very gratifying to see the potential CYGNSS has to make useful, practical contributions to people’s everyday lives by improving forecasts of storms and floods.” – Chris Ruf, PI, CYGNSS
The technology on each of the CYGNSS microsatellites is something familiar – a GPS! When CYGNSS sends GPS radio signals to the earth and they are bounced off of ocean waves, the signal that is reflected back to the satellite tells us what the winds are like right at the ocean surface. Since it was launched in 2016, scientists have been learning how to use CYGNSS data in many other ways too. It is able to show us flooded areas on land – during Hurricane Harvey, CYGNSS was used to identify the spread of the flooding over the Houston area. This helps “first responders” know which areas need urgent help during flooding disasters. Recently, CYGNSS has been used to help locate areas of a major locust outbreak in East Africa. CYGNSS satellites may be micro-sized, but they have a huge role in helping us better understand hurricanes, flooding, and locusts.