Top Menu

NASA logo
TAP

Archive | 1×1 RSS

Using Satellite Data to Map Air Pollution and Improve Health

NASA scientists will be teaming up with epidemiologists in the agency’s first health-focused mission. With satellite data, they’ll find out how air pollution affects health in cities around the world.

This map illustrates MAIA's multiangle measurement approach
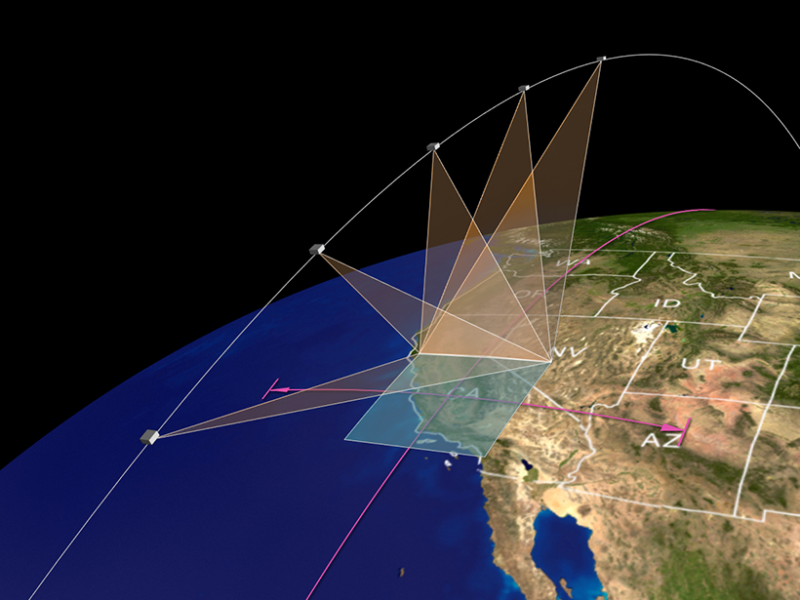
This map illustrates MAIA’s multiangle measurement approach. Credit: NASA/JPL-Caltech

By Jackie Rocheleau 15 April 2021

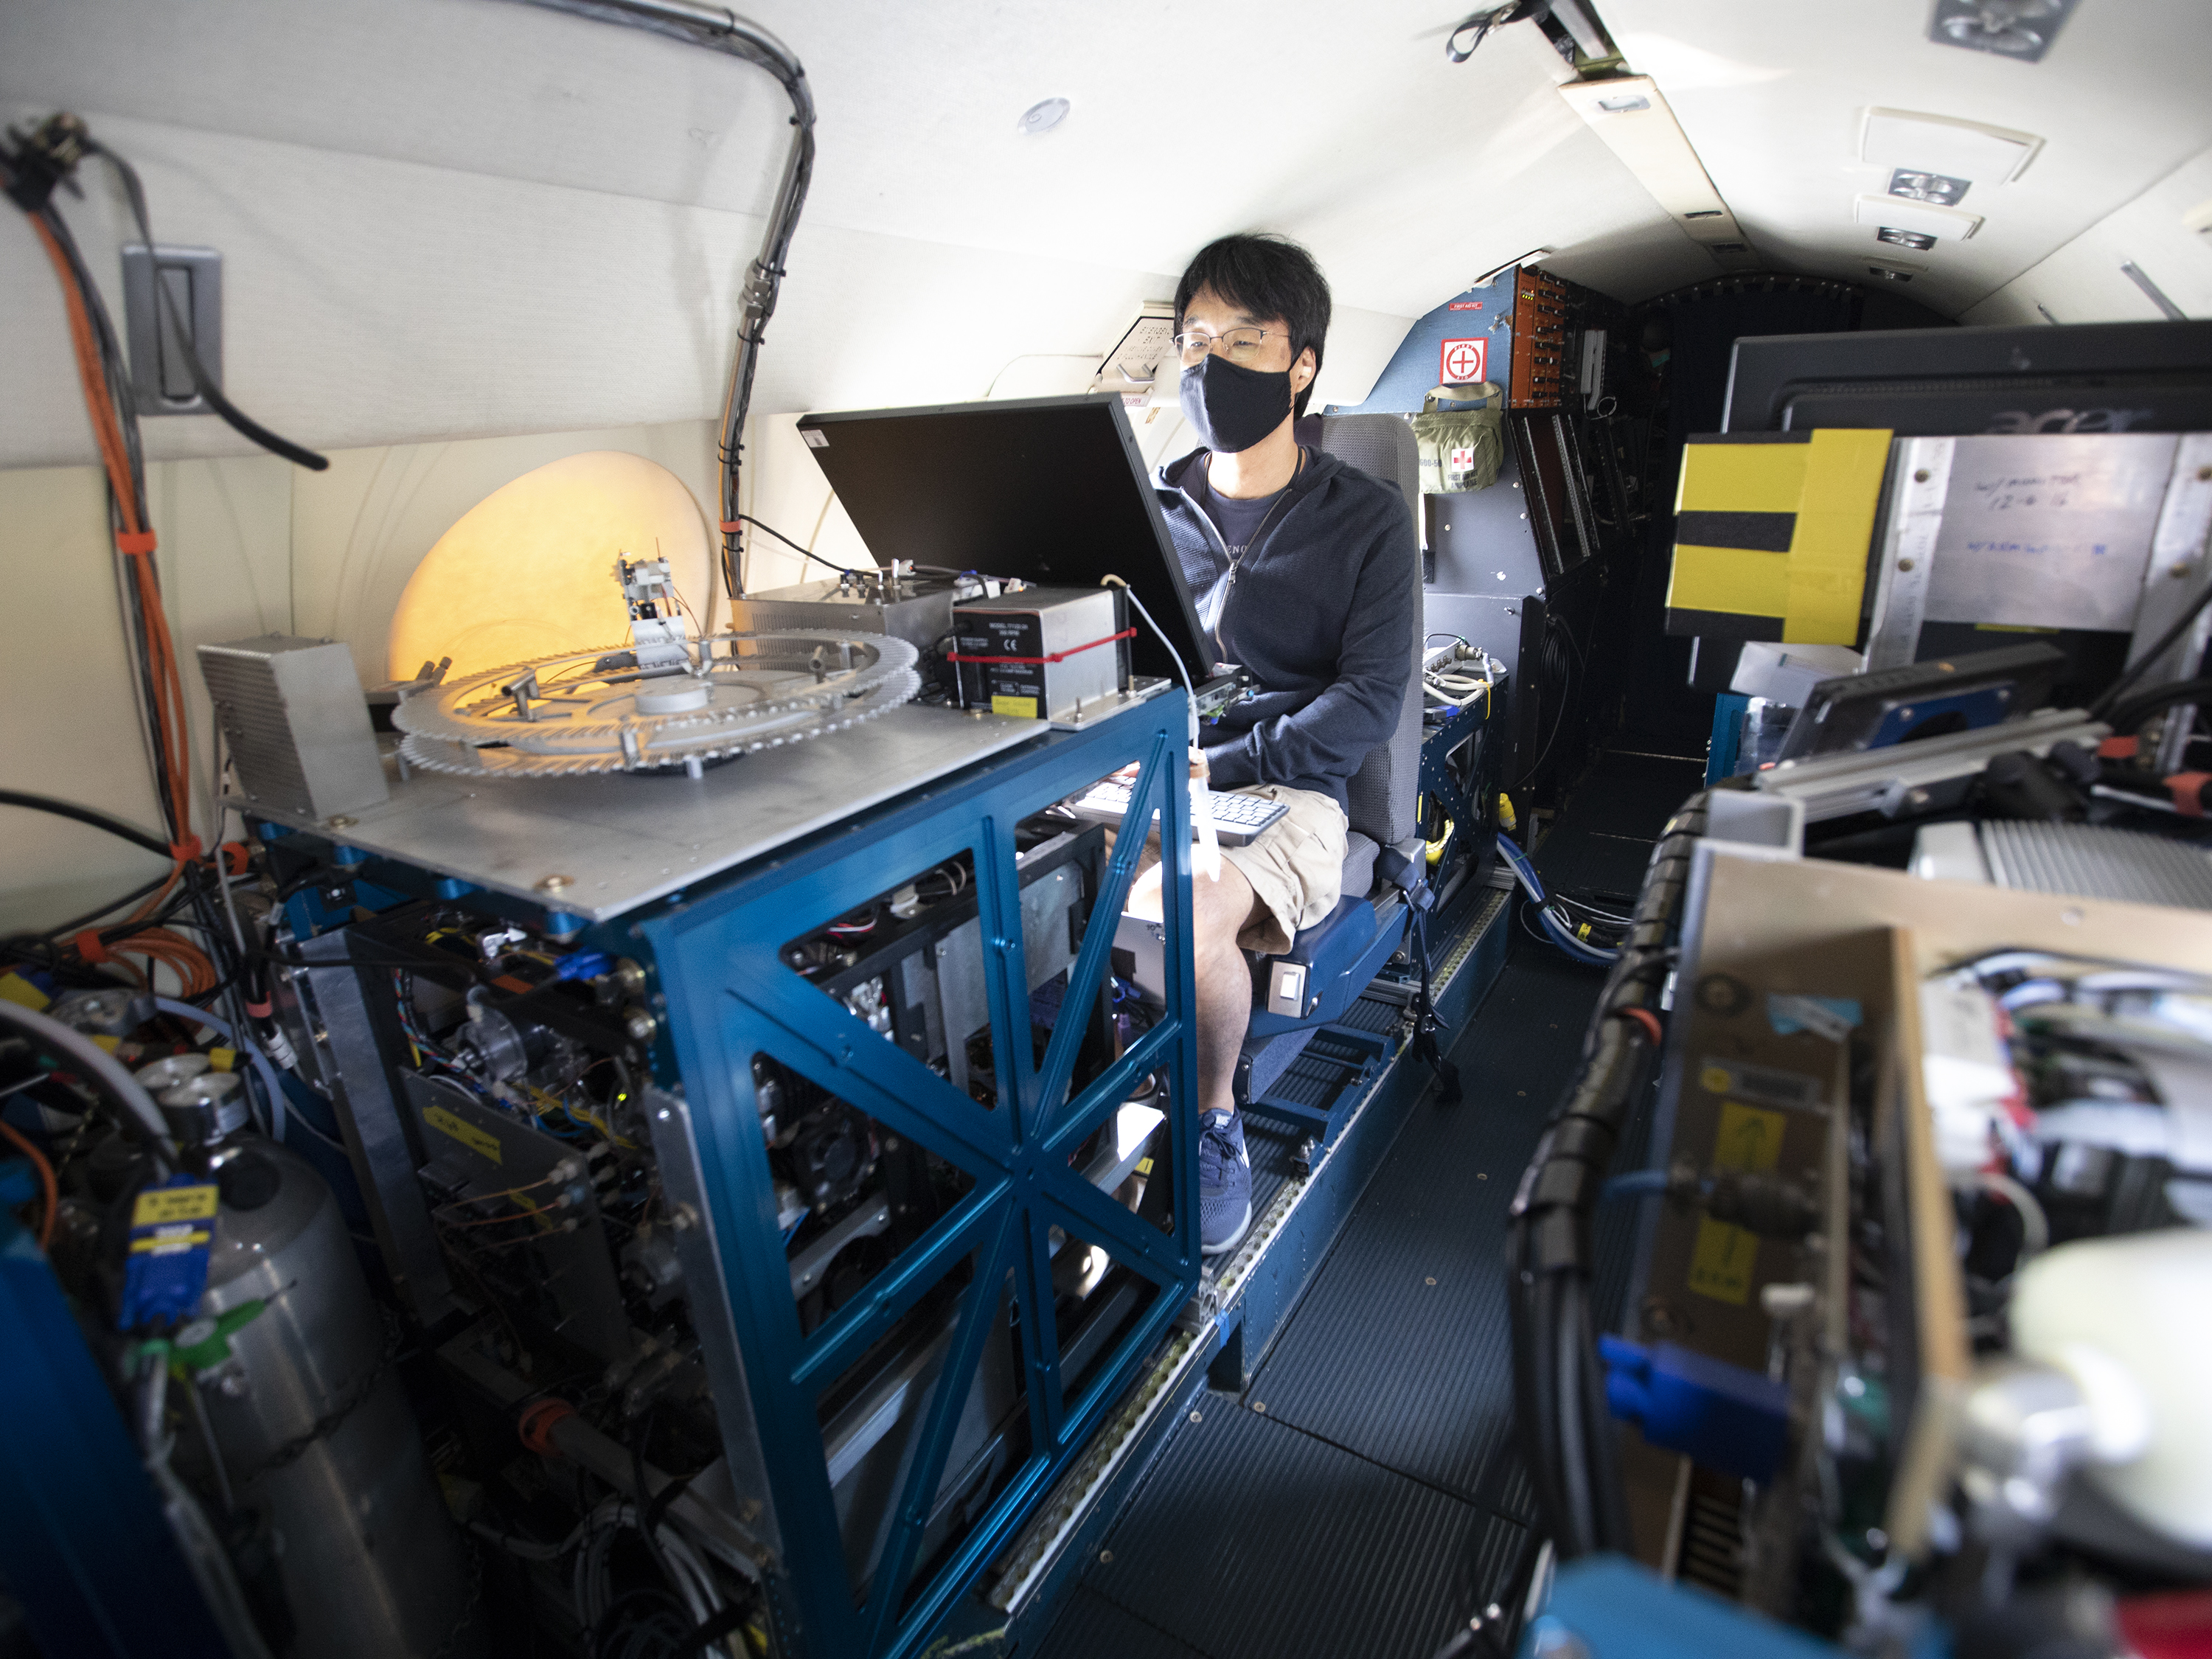
For epidemiologists studying air pollution, there’s only so much to learn at ground level. So they’ve been taking advantage of aerosol data from NASA satellites to link health outcomes with local air pollution. But only recently have NASA and epidemiologists teamed up to start the space agency’s first mission focused on health.

NASA’s Multi-Angle Imager for Aerosols (MAIA) mission, scheduled for launch in 2022, will combine the expertise of planetary scientists and epidemiologists to answer a question that, before now, has been largely impossible at a large scale: What kind of air pollutant particles is most harmful to human health?

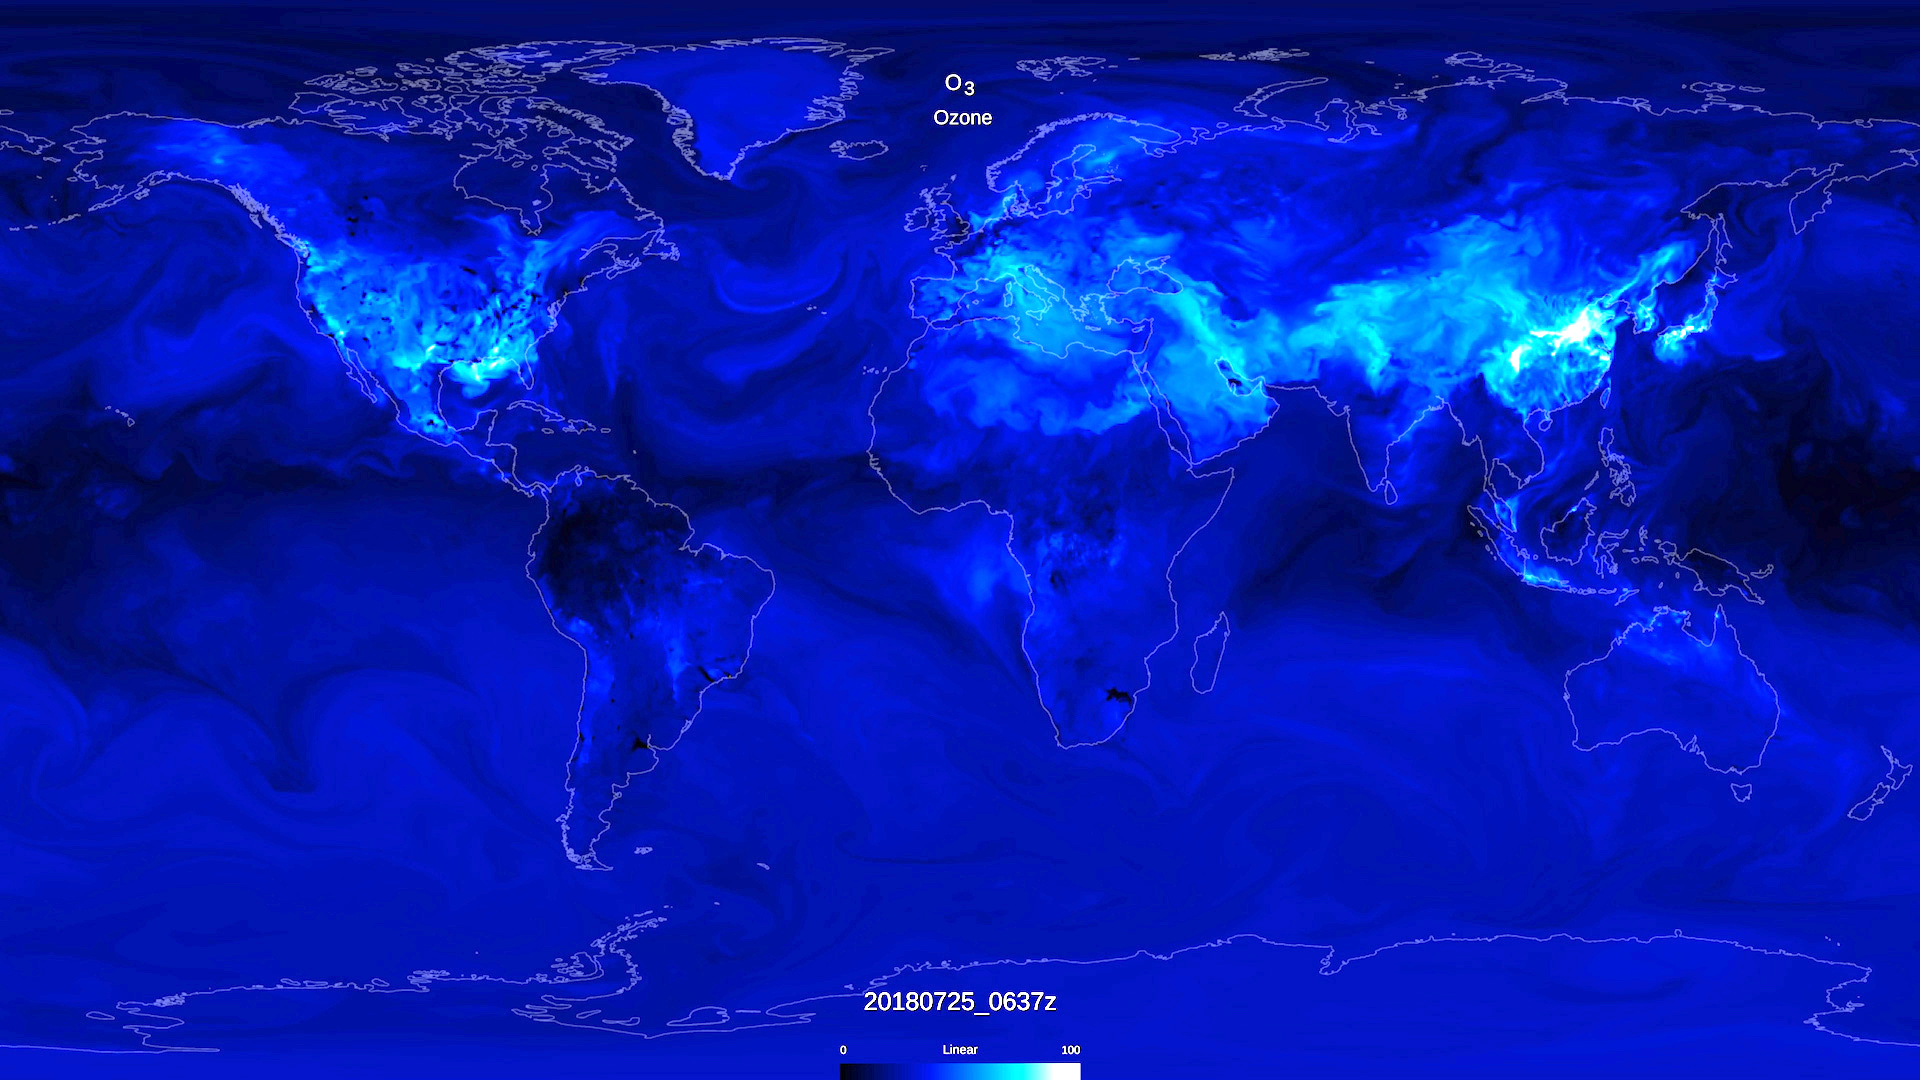
Of the different types of air pollutants, particulate matter (PM), especially particles smaller than 2.5 micrometers (PM2.5), poses some of the most severe health risks. These particles, which primarily form from combustion sources like fossil fuel use and wildfires, vary in composition but are small enough to pass from the lungs into the bloodstream. From there, they can travel all over the body. In the short-term, high PM2.5 levels in the air exacerbate respiratory diseases, whereas long-term exposure can even lead to premature death from heart and lung conditions. Scientists are predicting that climate change could worsen PM2.5 concentrations in some regions, though concentrations could decrease where emission sources are reduced. But even exposures below what regulators consider dangerous are associated with poor health outcomes, like increased mortality in older adults.

“We need to know what about the particles is the most toxic.”

To protect health, scientists need to know which PM components and sources are most harmful. Because PM sources differ between communities, that’s been a problem. “We can’t generalize from a traffic-related-pollution cardiovascular disease or a dementia link in urban areas to a rural area with mostly wood burning,” said Beate Ritz, an epidemiologist and environmental health scientist at the University of California, Los Angeles, and a MAIA coinvestigator.

There’s also the added complication that PM is classified by size, not by kind. “It’s easy to measure the size, not the type,” said Patrick Kinney, Beverly Brown Professor of Urban Health at Boston University. Relative to ground monitoring techniques that record concentrations and sizes of PM, there’s expensive laboratory analysis needed to tease apart particulate types. “We need to know what about the particles is the most toxic,” said Ritz.

Enter MAIA

For the past 20 years, health researchers have been using publicly available data from NASA’s Multi-angle Imaging Spectroradiometer (MISR) instrument to associate air pollution with health outcomes. But “an outstanding question is ‘which particular types and sources of particles are the most harmful?’” said David Diner, a scientist at NASA’s Jet Propulsion Laboratory and principal investigator of both MISR and MAIA.

Data from MAIA could answer that question. Aboard a commercial satellite from General Atomics Electromagnetic Systems, MAIA will circle the globe in low-Earth orbit for 3 years, passing each target study area three times per week at the same local time each pass. To infer the composition of PM2.5, scientists will use the optical properties of particles measured by MAIA: the polarization of sunlight scattered by particles and images of the light at multiple angles in 14 electromagnetic wavelengths spanning from ultraviolet to short-wave infrared. Researchers will map PM2.5 concentrations and composition at the neighborhood level (a resolution of 1 square kilometer) in its 12 primary target cities in North America, Europe, Africa, and Asia. Atmospheric chemistry, spatial, and statistical models will integrate the MAIA data and information from ground-based monitors to output a complete picture of ground-level concentrations of PM and components of PM2.5 in the target areas.

Kinney, a member of the independent scientific oversight committee but not part of the project, is excited about MAIA’s potential. But he’s cautious about taking satellite-based measures at face value. “We still should be careful to understand what the satellites are measuring,” he said. Like other satellite-based instruments, MAIA doesn’t measure particulates themselves, he said, but how they interact with light. (At ground level, scientists use filters to capture actual particles.)

Going Global

Epidemiologists plan to learn which particles are most toxic by linking PM data and population health records in each target area. They’ll study short- and long-term effects of PM exposure and adverse birth outcomes and cardiovascular disease, common issues tightly tied to air pollution.

The data, scientists say, are scalable. “There are many parts of the world where, especially in low- or middle-income countries, there’s just no ground-level monitoring or very, very sparse ground-level monitoring,” said Ritz.

“As time goes on, if we find out which components are driving the health effects, then that’ll help us target interventions.”
“We can do these health outcome studies in countries that do not have electronic medical records,” she continued. “If we can get [birth] data and mortality data in terms of cardiovascular disease, that’s enough to show that there’s an impact from air pollution on these outcomes.”

Ultimately, MAIA’s broad, high-resolution data will allow researchers to understand which communities are most affected by air pollution and what sources are responsible. For the past few years, Ritz has been working with interested scientists in MAIA’s target areas, helping them set up their research infrastructure. “What’s important about MAIA is that it will build these models based on very [data] rich areas, like Los Angeles,” said Ritz. “But then, [researchers] will apply these models to other parts of the country or the world, where ground monitoring doesn’t exist.” That kind of data, Ritz said, could provide momentum for air pollution regulations.

“It could help us understand the disparities in exposure and also understand how to address them by going after the sources that are responsible,” said Kinney. “And as time goes on, if we find out which components are driving the health effects, then that’ll help us target interventions.”

—Jackie Rocheleau (@JackieRocheleau), Science Writer

This story is a part of Covering Climate Now’s week of coverage focused on “Living Through the Climate Emergency.” Covering Climate Now is a global journalism collaboration committed to strengthening coverage of the climate story.

Reposted from original story

Citation: Rocheleau, J. (2021), Using satellite data to map air pollution and improve health, Eos, 102, https://doi.org/10.1029/2021EO157069. Published on 15 April 2021.
Text © 2021. The authors. CC BY-NC-ND 3.0

Except where otherwise noted, images are subject to copyright. Any reuse without express permission from the copyright owner is prohibited.

Continue Reading

Disappearing Deltas: The Delta-X Airborne Mission Investigates

NASA researchers are using high resolution airborne data to determine the vulnerability and resilience of the Mississippi River Delta.


Cynthia Hall, NASA ESDS Program Community Coordinator

Many of the world’s large deltas are in peril due to coastal land subsidence and sea level rise. The Mississippi River Delta is one of these disappearing systems; it’s the world’s seventh largest delta and is a living laboratory where scientists can gather data to learn how to save these valuable ecosystems and the services they provide.

Series of false-color satellite images chronicles the growth of the two deltas between 1984 and 2017. All of the images were acquired by instruments on Landsat satellites. Credit: NASA Earth Observatory

This series of false-color satellite images chronicles the growth of the Wax Lake Outlet Delta (upper feature) and the Atchafalaya River Delta (lower feature) in Louisiana between 1984 and 2017 where they empty into the Gulf of Mexico. All of the images were acquired by instruments aboard the joint NASA/USGS Landsat series of satellites. Credit: NASA Earth Observatory.

On average there is one delta for every 300 km of shoreline around the world. As rivers meet the ocean, slowing down and fanning out, sediments are dropped, forming a delta. Coastal waves, river discharge, vegetation, and tidal water flow all influence the development of deltas. Coastal communities rely on deltaic environments for many reasons and their disappearance can have catastrophic effects. Deltas serve as a buffer for storm surges, thereby protecting mainland areas; they serve as nurseries for a variety of marine organisms; they sustain and provide sustenance for biologically diverse ecosystems; and their soil serves as a filter that removes toxins from the water. The loss of a delta to subsidence and sea level rise would result in numerous environmental, economic, and social impacts on coastal communities.

The Mississippi River Delta is a unique testbed in that it is sinking in some areas, like the Terrebonne Basin, but growing in adjacent areas, like the Atchafalaya Basin to the west. The Terrebonne Basin is engineered (marked by channelization and levees), and this has decreased sediment flow to the delta floodplain. Large parts of the Atchafalaya Basin, conversely, allow rivers to deliver sediment to that basin. According to Delta-X principal investigator (PI) Dr. Marc Simard and co-PI Dr. Cathleen Jones at NASA’s Jet Propulsion Laboratory in Pasadena, CA, the Mississippi River Delta offers the unique opportunity to investigate areas with similar vegetation and climate, but very different soil accretion patterns. Understanding delta formation in an environment like the Mississippi River Delta, that is experiencing both erosion and accretion, is important because the U.S. Gulf Coast is experiencing some of the highest levels of global sea level rise: between 9 to 12 mm per year, which is three-to-four times the global average.

The Investigation

Delta-X Logo

NASA’s Delta-X airborne mission, with flights that began on March 26, 2021, is gathering remotely sensed and in situ data to study changes occurring to the water, vegetation, and sediment along the Atchafalaya and Terrebonne Basins. The data will be assimilated into a model to forecast the resilience and vulnerability of the delta given the rising seas; the framework for the model can be used for forecasting change in other delta systems around the world. Delta-X was competitively selected through NASA’s Earth Venture Suborbital-3 program.

Delta-X uses three primary airborne sensors: the Airborne Visible-Infrared Imaging Spectrometer-Next Generation (AVIRIS-NG), an instrument with high spectral resolution at visible wavelengths; the Air Surface Water and Ocean Topography (AirSWOT) instrument suite, which includes a Ka-band synthetic aperture radar (SAR); and the Uninhabited Aerial Vehicle Synthetic Aperture Radar (UAVSAR), which collects data in the L-band. Wavelength is an important feature to consider when working with SAR since the wavelength determines how the radar signal interacts with the surface and how far the signal penetrates into a medium. The Ka-band represents a shorter wavelength and is able to measure highly reflective rough water surfaces with little to no vegetation, whereas the longer wavelength L-band can penetrate more heavily vegetated areas to measure changes in the water surface below vegetation.

For more information on sensors and spectral resolution, see the Earthdata Backgrounders What is Remote Sensing and What is Synthetic Aperture Radar.

These airborne instruments collect data more frequently than satellites in order to detect changes to water levels and sediment concentration over a full tidal cycle (the Gulf Coast experiences diurnal tides, meaning one high and one low tide per day). The data will be collected concurrently on three different aircraft, while scientists in the field collect in situ data at the same time. This facilitates multi-scale and multi-instrument calibration of models. These models will be used to validate upcoming satellite missions like the Surface Water and Ocean Topography (SWOT) and the NASA/Indian Space Research Organization (ISRO) Synthetic Aperture Radar (NISAR) missions. These missions will not have the ability to make multiple measurements during a single tidal cycle, however. SWOT will obtain measurements over a given area every 21 days and NISAR every 12 days.

Delta-X makes breakthrough advances in the study of deltaic evolution, moving beyond coarse areal averaging to resolve mesoscale features. Click on image for larger view. Credit: NASA's Jet Propulsion Laboratory.

Delta-X makes breakthrough advances in the study of deltaic evolution, moving beyond coarse areal averaging to resolve mesoscale features. Click on image for larger view. Credit: NASA’s Jet Propulsion Laboratory.

The data from Delta-X will be used to calibrate and validate a series of dynamic, hydroecological models, which can then be used to forecast the future of the Mississippi River Delta. Delta formation models before AirSWOT were developed at a coarse scale. Delta-X co-PI Jones equates this to a bathtub view, in which you are looking at the entire deltaic system (macroscale). To more accurately predict the resilience of the delta and inform realistic remediation plans, measurements at a smaller, or mesoscale (around one hectare [10,000 m2] or roughly the size of a sports field), are needed. To make better predictions about delta formation, scientists need to be able to define channels, surface water levels and discharge, sediment movement, and plant production at a much finer resolution than coarse areal averages.

The UAVSAR data will create maps of water level changes in wetlands over time; AirSWOT data will provide water surface elevation measurements over the same time period, but within channels and lakes. These measurements help with understanding river discharge and sediment transport across the floodplain’s wetlands. There are two processes which contribute to soil accretion: delivery of sediments and plant production of organic material (i.e. roots and litter). AVIRIS-NG will be used to estimate the quantity of sediment being transported in the rivers and also to estimate plant structure, including species, biomass, and spatial distribution. This information will be incorporated into a model that simulates how the delta evolves.

Left image: Vegetation classification of the Atchafalaya Basin, LA, Right image: Map of water level changes based on water surface elevations measured by UAVSAR

Left image: Vegetation classification of the Atchafalaya Basin, LA, using data acquired from the AVIRIS-NG sensor, 2016. Credit: Jensen, D.J., Simard, M., Twilley, R., Castaneda, E. & McCall, A. 2020. NASA’s ORNL DAAC (DOI: 10.3334/ORNLDAAC/1821). Right image: Map of water level changes based on water surface elevations measured by UAVSAR on October 16, 2016, at 14:08 and 16:37 UTC. Credit: Jones, C., Simard, M. & Lou, Y. 2020. NASA’s ORNL DAAC (DOI: 10.3334/ORNLDAAC/1823).

All of these variables help scientists better understand the processes contributing to soil accretion, which is what is needed to save these critical geomorphic systems. Changing variables within the model will provide scientists with insight as to how the delta will respond under different circumstances.

The models based on Delta-X data, once developed and calibrated, determine how much sediment will need to be put back into the system sustainably, that is, in the most natural way possible, to mitigate the impacts of a rising sea. Jones notes, “…deltas are really sensitive. They live in this balance between losing and gaining land. But if we understand all the processes developed over millennia that have kept them in balance, we will be able to reverse some of the [loss].” The Delta-X modeling framework can be used for forecasting change in other delta systems around the world by using its remote sensing and numerical model parameters.

The Application

Model output showing particle flow from the Wax Lake Delta

Model output showing particle flow from the Wax Lake Delta. Developed through a Python package from Hariharan, J., Wright, K. & Passalacqua, P. (2020). “dorado: A Python package for simulating passive particle transport in shallow-water flows.” Journal of Open Source Software, 5(54): 2585 [DOI: 10.21105/joss]. Credit: NASA’s Jet Propulsion Laboratory.

The state of Louisiana has a $50 billion, 50-year plan to protect its coastline from erosion and rising sea levels. Data from Delta-X could help better inform coastal restoration efforts and sediment diversions.

According to Delta-X co-PI Simard, “In terms of application, Delta-X is very important; there is a science component of course, but application-wise we are really hoping it’s going to support decision making . . . to inform the state [of Louisiana] about remediation plans.” In fact, the Delta-X team has been interfacing with Louisiana’s Coastal Protection and Restoration Authority and the non-profit Water Institute of the Gulf in Baton Rouge to help develop sustainable coastal restoration efforts. In addition, 12 co-investigators from eight institutions, along with undergraduate, graduate, and postdoctoral students, have been involved in mission planning and will be working tirelessly in the coming months to understand this fragile ecosystem.

While the data and models from Delta-X are specifically for the Mississippi River Delta, Simard notes that, “the framework can be applied [to other deltas]. We can either take the model parameter values obtained during Delta-X to implement models elsewhere or, even better, we can have another Delta-X campaign over those other deltas to do a better job there too.”
Data Availability

To demonstrate the viability of the mission, two pre-Delta-X missions were conducted in 2015 and 2016. The data from these campaigns are archived at NASA’s Oak Ridge National Laboratory Distributed Active Archive Center (ORNL DAAC) and can be accessed at the links below:

Pre-Delta-X data in Earthdata Search
Pre-Delta-X data at ORNL DAAC

Delta-X data are expected to be available through Earthdata Search and ORNL DAAC in the fall of 2022. To keep up to date on the Delta-X campaign, read the Delta-X Science Blog.

Original Article Published April 12, 2021

Continue Reading

ACTIVATE Begins Year Two of Marine Cloud Study

NASA's ACTIVATE mission recently began its second year of flights. Here, final preparations are being made to the HU-25 Falcon prior to a flight.

A NASA airborne study has returned to the field for a second year of science flights to advance the accuracy of short- and long-term climate models.

The Aerosol Cloud meTeorology Interactions oVer the western ATlantic Experiment (ACTIVATE) began the third of six planned flight campaigns — two campaigns each year beginning in 2020 and ending in 2022 — in late January at NASA’s Langley Research Center in Hampton, Virginia.

Cloud formation in the atmosphere depends on the presence of tiny particles called aerosols. ACTIVATE scientists are working to understand how variations in these particles from human and natural sources affect low lying clouds over the ocean and how those clouds in turn affect the removal of these particles from the atmosphere.

Cloud feedback, or the absorption and reflection of solar energy by clouds, is one of the biggest remaining uncertainties in climate models. By unraveling some of the mysteries of the formation and evolution of clouds, ACTIVATE scientists will provide crucial data to reduce those uncertainties.

Researcher Luke Ziemba checks an instrument on the Falcon prior to a flight.

Luke Ziemba checks an instrument
Researcher Luke Ziemba checks an instrument on the Falcon prior to a flight.
Credits: NASA/David C. Bowman

The western North Atlantic Ocean is an ideal location for the study because it provides a wide range of weather conditions and receives a variety of aerosol types from sources such as the East Coast, the ocean and even wildfires from the West Coast — as researchers learned during the 2020 flights.

Cloud droplets can form on those aerosols and the first year of flight data revealed the broad range of cloud droplet number concentrations in this region of the Atlantic. These concentrations — not especially well represented in existing datasets — are a fundamental driver of the clouds themselves, and are thus key to understanding the multiple cloud types with varying properties based in the boundary layer area near the ocean’s surface. Data from the 2020 flights indicate that the outflow of North American pollution is a major source of aerosols activating into droplets, with a trend toward lower particle and drop concentrations with distance from the shore.

Also noteworthy from the 2020 flights was sampling in cold-air-outbreak conditions, where instrument data are currently being used to validate and improve models trying to better simulate development of associated clouds. Scientists believe the dry air causes aerosols near the ocean surface to change shape, which alters how they scatter light. The frequency and magnitude of these events was unexpected and affects how researchers use satellite measurements to retrieve information about the amount, type and properties of these aerosols.

HU-25 Falcon and King Air

HU-25 Falcon and King Air
The HU-25 Falcon and King Air on the tarmac prior to a flight. The aircraft fly in coordinated fashion — the Falcon flying through clouds taking measurements from the surrounding atmosphere, and the King Air flying at higher altitude taking both complementary remote sensing measurements from above and launching dropsondes to get important weather data.
Credits: NASA/David C. Bowman

To collect this data, the study employs two aircraft flying in coordinated fashion — an HU-25 Falcon flying through clouds taking measurements from the surrounding atmosphere and a King Air flying at higher altitude taking both complementary remote sensing measurements from above and launching dropsondes to get important weather data.

COVID-19 forced the ACTIVATE team to alter its 2020 flight schedule and push the second set of flights originally planned for the spring to late summer. With continued stringent safety protocols, ACTIVATE researchers hope to stick to their planned schedule in 2021, with the current flights lasting through March and a second set of flights in May and June.

“Our team did a remarkable job of persevering and staying focused under very challenging circumstances last year, and we aim to continue that momentum and focus into this next deployment,” said Armin Sorooshian, ACTIVATE principal investigator and atmospheric scientist at the University of Arizona. “If the 2021 flight data are anywhere near as intriguing in terms of the range of aerosol and meteorological conditions we observed in 2020, they’ll be extremely rich and build on an already large and valuable data archive for the international research community. Building statistics across a range of atmospheric variability is critical for better understanding of aerosol-cloud-meteorology interactions.”

ACTIVATE is one of five NASA Earth Venture Suborbital campaigns originally scheduled to take to the field in 2020. Three of the five were postponed in 2020 due to logistical and safety challenges posed by COVID-19. To learn more about the other campaigns, visit: https://www.nasa.gov/feature/goddard/2019/nasa-embarks-on-us-cross-country-expeditions

Joe Atkinson
NASA Langley Research Center


Read Full Article
*Source: NASA.gov

Continue Reading

ACTIVATE Makes a Careful Return to Flight

Masks are part of the safety protocol for ACTIVATE scientists. Here, Yonghoon Choi prepares for a science flight on the HU-25 Falcon. Credits: NASA/David C. Bowman

Masks are part of the safety protocol for ACTIVATE scientists. Here, Yonghoon Choi prepares for a science flight on the HU-25 Falcon.
Credits: NASA/David C. Bowman

Four months ago, with COVID-19 disrupting life across the globe, it seemed virtually unthinkable that a major NASA airborne science campaign would fly again anytime soon.

But today, that’s exactly what’s happening.

In August, NASA’s Aerosol Cloud Meteorology Interactions Over the Western Atlantic Experiment (ACTIVATE) eased into its second set of 2020 science flights out of NASA’s Langley Research Center in Hampton, Virginia. Barring any threats to the health or safety of the researchers or crew, flights will continue through the end of September.

The HU-25 Falcon sits on the tarmac just ahead of a flight. Credits: NASA/David C. Bowman

The HU-25 Falcon sits on the tarmac just ahead of a flight.
Credits: NASA/David C. Bowman

Those flights are taking scientists over the western Atlantic Ocean to study how atmospheric aerosols and meteorological processes affect cloud properties. In addition, modelers will use data from these flights to better characterize how the clouds themselves, in turn, affect aerosol particle properties and the amount of time they spend in the atmosphere, as well as the meteorological environment. Coordinated flights between a King Air and an HU-25 Falcon allow researchers to fly above, below and through the clouds with a suite of instruments that can take measurements remotely, or from the air around the aircraft.

“The data have been really good so far,” Armin Sorooshian, ACTIVATE principal investigator and an atmospheric scientist at the University of Arizona, said of the summer flights. “We’ve seen some interesting features, like smoke from the wildfires on the West Coast.”

That smoke can seed clouds over the Atlantic Ocean.

Sorooshian is leading the campaign remotely from his home in Tucson, Arizona, where he and his wife are juggling work and the care of two children — a two-year-old boy and a baby girl who was born in July.

He admits it’s “a little tough.” But in a world where these flights could have been scrubbed from the calendar completely, Sorooshian isn’t interested in dwelling on the negatives.

“They’re good problems,” he said.

Good Problems

The ACTIVATE team began the first of two planned 2020 flight campaigns in February. They completed most of those flights, but had to pull the plug a little early in mid-March when concerns about the spread of COVID-19 began to sweep across the U.S. At that point, the fate of the second set of flights, originally scheduled for May and June, was — pardon the pun — very much up in the air.

As the COVID situation evolved, though, and as Langley leadership began to admit a limited number of research projects back on center with stringent safety protocols in place, it became clear there might be a glimmer of hope for ACTIVATE.

The King Air rolls out of the hangar before a science flight. Credits: NASA/David C. Bowman

The King Air rolls out of the hangar before a science flight.
Credits: NASA/David C. Bowman

ACTIVATE is uniquely positioned among other current NASA airborne science missions because it’s based out of a NASA center, and the flight crew and many members of the science team are also based out of that center. John Hair, ACTIVATE project scientist with Langley’s Science Directorate, knew that from a purely logistical perspective, the mission could return to flight without the need for anyone to travel in from out of town.

“We had an opportunity because ACTIVATE has a relatively small crew that can operate the instruments in the aircraft, and do that, we felt, safely — albeit with some changes to the initial plans we set out,” he said.

Besides obvious stuff such as wearing masks and being mindful of social distancing, those changes include conducting the various daily flight planning meetings and pre-flight briefings completely via video conference. Researchers are also doing real-time monitoring of flight data from their homes. For researchers who are flying or need to be on center, the project has found ways to streamline some processes.

“For example, people are learning how to do their calibrations at the end of the flight after the instruments are already warmed up,” said Hair. “And then it only takes an hour to do.”

Compare that to the three or four hours it can take a researcher to warm up and calibrate an instrument before a flight.

The entire operation has taken a lot of careful planning and coordination between Langley’s Science Directorate, Research Services Directorate and Center Operations Directorate. Sheer determination has certainly played a role as well.

“We all signed up for supporting research as it comes in. ACTIVATE was in the middle of a major campaign and we wanted to get them back to flying as soon as we could,” said Taylor Thorson, ACTIVATE project pilot with Langley’s Research Services Directorate.

Sorooshian believes this experience could be instructive for the next round of flights, which are currently scheduled to kick off in February 2021 when COVID-19 could still be a significant concern.

It’s not just instructive from a safety perspective. Marine clouds are more scattered and difficult to forecast in the summer.

“Flying this summer also allows the team to hone the flight planning strategies, which can build upon heading into the next two years of flight campaigns,” he said.

For now, he and Hair are just happy to see a study they both care deeply about back in action.

“This is exciting that we’re out doing some flights,” said Hair. “People are excited to get the critical science data that we’re collecting on these flights.”

The ACTIVATE science team includes researchers from NASA, the National Institute of Aerospace, universities, Brookhaven National Laboratory, Pacific Northwest National Laboratory, the National Center for Atmospheric Research and the German Aerospace Center. The current flight campaign is the second of two in 2020, with two more to follow in 2021, and another two in 2022.

ACTIVATE is one of five new NASA Earth Venture campaigns originally scheduled to take to the field in 2020. Three of the five have been postponed due to COVID-19. To learn more about the other campaigns, visit: https://www.nasa.gov/feature/goddard/2019/nasa-embarks-on-us-cross-country-expeditions

Joe Atkinson
NASA Langley Research Center


Read Full Article
*Source: NASA.gov

Continue Reading

Christina Moats-Xavier

Christina Moats-Xavier

Christina Moats-Xavier

Credits: Christina Moats-Xavier

What do you do?

I am the Deputy Program Manager for the Earth System Science Pathfinder Program.

How do you support ESSP projects?

I am responsible for ensuring day to day successful operations, identifying and implementing solutions to problems, and supporting/developing all members of the team in order to ensure the success of our team members and all of the Projects in the ESSP portfolio.

Why is ESSP and the Science important to you?

I love to explore and experience new things. This has included record-breaking, gale force winds in the Scottish Highlands; trekking to Everest Base Camp; and learning about the various cultures while hiking in the Himalayas. Traveling and being out in nature is a big part of these adventures.

I was raised on the west coast of the US, spent many years in the mountains of West Virginia, and now live on the US east coast. In each location, I’ve experienced noticeable changes in the weather over time. I am concerned about our impact on the Earth and how this will influence future generations. The Science obtained by the ESSP projects is enabling understanding, modeling, and prediction of Earth system science processes; this can be used by stakeholders and decision makers to enact change. I feel privileged to be a small part of this.

Christina Moats-Xavier

Credits: Christina Moats-Xavier

<span class="credits">Credits: Christina Moats-Xavier</span>

Credits: Christina Moats-Xavier

<span class="credits">Credits: Christina Moats-Xavier</span>

Credits: Christina Moats-Xavier

Alaska snowmobiling

Credits: Christina Moats-Xavier

Alicia Chipman

Alicia Chipman

<span class="credits">Credits: Alicia Chipman</span>

Credits: Alicia Chipman

<span class="credits">Credits: Alicia Chipman</span>

Credits: Alicia Chipman

What do you do at ESSP?

I am the Configuration Manager/IT Specialist at the Earth System Science Program office. I have the privilege of working with talented project managers and scientists from around the world. I am also honored to provide the public face of ESSP by curating and maintaining our public access website, bringing our story and sharing the findings of our amazing Earth missions.

How do you support ESSP projects?

My position provides records management for our missions and process development for our program office. I ensure that we are keeping our mission documentation according to contract requirements, NASA standards, export controls and privacy. I also provide a venue for scientists to share their amazing discoveries and data through our public access website.

How does the work ESSP does impact the lives of this generation and future generations?

I feel that what we do here at ESSP is vital to the future of our planet and the lives of future generations who will live here. We are providing oversight to extremely important studies of how our planet is changing and how it adversely affects the air we breathe, water we drink, and habitats we live in. Providing these studies gives leaders information in order to make decisions about changes in policy that can help to heal our planet and provide future generations with the same privilege of an amazing, and beautiful planet on which to live.

Why is ESSP and the Science important to you?

ESSP and the Science that happens under our purview is important to me because I have spent my whole life seeing the way that our planet is changing. The area I grew up in is being visibly affected by sea level rise. Places that I used to play as a child are under water. Summer storms are getting more prevalent and increasingly severe. The air we breathe and the water we drink are contaminated by chemicals. I believe that we owe our children a safe place to live where they can drink the water and breathe without fear. I love working at ESSP and seeing the science that is striving to change people’s views of our ecosystems and giving the world data to help facilitate change.

What do you think will happen if we don’t address this issue? Is there an urgency?

If we do not address the issues investigated through ESSP and other scientific organizations we are going to lose our fresh air, clean water, homes, food and habitats. We tend to think of things from a very narrow view of the world. If we don’t change this view and implement solutions NOW the problem will only get worse. These are urgent issues as the Earth is our responsibility to preserve and the longer we delay action, the worse things will become. When your boat has a hole in it you don’t wait until it sinks to fix it…

How NASA is Helping the World Breathe More Easily

Look around. Can you see the air? No?

Luckily, many of NASA’s Earth-observing satellites can see what the human eye can’t — including potentially harmful pollutants lingering in the air we breathe. From the vantage point of space, these satellites help us measure and track air pollution as it moves around the globe and have contributed significantly to our decades-long quest for cleaner air.

When we talk about “air pollution,” we’re referring to chemicals or particles in the atmosphere that are known to have negative health effects on humans. The Clean Air Act of 1970 established legislation that requires the tracking of six of those pollutants — nitrogen dioxide (NO2), ground-level ozone, carbon monoxide, particulate matter (microscopic specks of solid or liquid material in the air), sulfur dioxide, and lead. Satellite instruments are measuring all of these except lead.

NASA has been involved in the study of air quality for decades from space and with ground sensors, creating a time series of global data records critical to understanding the impacts and causes of air pollution and to helping design solutions. This article highlights a few of the many projects under way now and planned for the years to come.

Air pollution can appear as a gray or orange haze enveloping a city. What the naked eye can’t see are the hundreds of chemical reactions taking place to produce that pollution. NASA science can reveal a more complete picture of atmospheric chemistry.
Credits: NASA’s Goddard Space Flight Center/Scientific Visualization Studio
Download This Video in HD from NASA Goddard’s Scientific Visualization Studio


Measured in Space, Used on Earth

In analyzing spaceborne data, one thing is abundantly clear — reducing emissions from human activities can have a profound effect on air quality.

China’s recent large-scale response to the COVID-19 pandemic, which included quarantines and limitations on industrial activities and travel, is a particularly vivid example of this. Data from instruments on NASA’s Aura and the European Space Agency’s Sentinel-5 satellites showed a significant decrease in nitrogen dioxide (NO2) — a noxious gas emitted by power plants, industrial facilities and motor vehicles — over much of the country during that time.

The pandemic presents a unique use-case for spaceborne Earth observations; however, satellite-derived air quality data have applications across a wide array of disciplines. That’s where NASA’s Health and Air Quality applications program demonstrates its value. The program builds invaluable partnerships with other agencies, industry and nonprofits to facilitate the use of this data in solving real world problems.

“We funded a project led by the Environmental Protection Agency (EPA) to assimilate NASA Earth observations into their “AirNow” system,” said program manager John Haynes.

The AirNow system is the EPA’s platform for distributing national, real-time air quality reports and forecasts. The measurements primarily come from thousands of monitoring stations on the ground across the United States, Mexico, and Canada; however, those ground monitoring stations are not all-encompassing.

“The ground monitors cover a good part of the U.S., especially around metropolitan areas. But there are large sections of the country that don’t have monitoring stations,” said Haynes. “By introducing satellite aerosol optical depth observations from the MODIS instrument, we can measure those areas too, which allows us to form a more accurate image of how air pollution — and specifically fine particulate matter — is distributed across the country and how it changes over time.”

By incorporating data from the Ozone Monitoring Instrument (OMI), a Dutch-Finnish contribution to NASA’s Aura satellite mission, the EPA and NASA were also able to identify a significant drop in NO2 over the last 15 years in the United States — evidence that regulations put into place by the Clean Air Act 50 years ago — vehicle gas mileage regulations, a shift to cleaner fuels, and so on — are, indeed, working.

“We’ve been able to show that since 2004, NO2 levels have dropped as much as 50% depending on what metropolitan area we’re talking about. In fact, the air in the United States is now the cleanest it has been in the modern industrial era,” Haynes said.

While ozone in the stratosphere is critical to maintaining life on Earth, surface ozone, shown here, is a toxic gas to most plant and animal species. NASA merges satellite data with models to provide a snapshot of chemistry throughout the atmosphere at any given time and help predict air quality worldwide. Credits: NASA's Goddard Space Flight Center/Scientific Visualization Studio

While ozone in the stratosphere is critical to maintaining life on Earth, surface ozone, shown here, is a toxic gas to most plant and animal species. NASA merges satellite data with models to provide a snapshot of chemistry throughout the atmosphere at any given time and help predict air quality worldwide.
Credits: NASA’s Goddard Space Flight Center/Scientific Visualization Studio

Connecting the (data) dots

With the abundance of data coming in — there are dozens of Earth-observing satellites currently on orbit — one of the biggest challenges is connecting stakeholders with the right “tools” or datasets for what they’re trying to accomplish, and in some cases, teaching them how incorporate this type of data into their planning.

“To address this issue, our team has developed a website where we help users navigate all of these resources, from someone who has never really used satellite data before to more advanced stakeholders looking to make better decisions and inform the public on issues of air quality,” says Tracey Holloway, leader of the NASA-funded Health and Air Quality Applied Sciences Team (HAQAST), a group of air quality and public health scientists from government offices and universities across the country.

Wildfires in California, for example, have caused air quality concerns in recent years. A HAQAST tiger team was able to look at emissions and develop new methods for using existing data from the VIIRS and MODIS instruments to support the state of California in its understanding and quantification of emissions. HAQAST also helped to get data from newer satellites like GOES-16 into the state’s hands.

According to the Global Burden of Disease report, air pollution is the leading environmental cause of mortality — a statistic of which many in the public health sector are well aware. And the availability of satellite observations is changing the dialogue around it.

“Just within the health community, we have observed the growing trend of research collaborations that bridge expertise across environmental health disciplines. As we continue to train the global health workforce, we must identify the skillsets that can prepare the workforce to manage the emerging risks of the future. For example, one skillset is the knowledge and use of innovative data sources – including satellite data – whether they apply data for research purposes or interpret findings for educational outreach activities,” said Helena Chapman, associate program manager of NASA Health and Air Quality applications.

Holloway adds, “The abundance of satellite data right now is amazing. Just in the past 10 years, it’s been remarkable how many agencies, nonprofits, cities and states have gone from not even knowing satellites could detect air pollution to actively using the data in their day-to-day operations.”

Looking Ahead

Right now, our satellites can measure a number of chemicals in the air over the United States and globally on a daily basis. But several missions scheduled to launch in the next few years will be able to do even better.

For example, the Tropospheric Emissions: Monitoring Pollution (TEMPO) mission is designed to measure several different pollutants — including NO2 and ozone — over the United States during every daylight hour. TEMPO will give scientists the ability to see how pollution sources and concentrations change throughout the course of a day. Part of an international constellation of like satellites that includes South Korea’s Geostationary Environment Monitoring Spectrometer (GEMS), and the European Space Agency’s Sentinel-4, TEMPO is scheduled to launch in 2022.

The Multi-Angle Imager for Aerosols (MAIA) mission, also scheduled to launch in the early 2020s, will improve our understanding of particulate matter — those tiny, microscopic particles lingering in the air — with particular focus on large metropolitan areas. Data like this will help the health community better understand the connection between aerosol pollutants and health problems including adverse birth outcomes and cardiovascular diseases.

“MAIA will allow us to study these aerosols in detail, tell us how big they are and how many of them are in that very small category that is most harmful to human health,” said Barry Lefer, program scientist of NASA’s Tropospheric Composition program. “We’ll also be able to better understand what the particles are made of which will lead us to where they came from (like auto exhaust for example).”

Even further in the future, the possibilities are many.

“I’d love to see a future where real-time Earth observation data is seamlessly and continuously available to everyone — from orbit to the palm of your hand,” said Haynes. “It would allow anyone to make fast decisions regarding air quality and their health.”

By Esprit Smith

NASA’s Earth Science News Team

Continue Reading

NASA, French Space Laser Measures Massive Migration of Ocean Animals

RELEASE 19-091

Researchers used the space-based CALIPSO lidar to measure the planet’s largest animal migration, which takes place when small sea creatures swim up from the depths at night to feed on phytoplankton, then back down again just before sunrise. Credits: NASA/Timothy Marvel

Researchers used the space-based CALIPSO lidar to measure the planet’s largest animal migration, which takes place when small sea creatures swim up from the depths at night to feed on phytoplankton, then back down again just before sunrise.
Credits: NASA/Timothy Marvel

Tiny creatures such as small squid, fish and krill are part of the massive vertical migration pattern in the ocean that has now been measured around the world from space. Credits: Chandler Countryman

Tiny creatures such as small squid, fish and krill are part of the massive vertical migration pattern in the ocean that has now been measured around the world from space.
Credits: Chandler Countryman

Every night, under the cover of darkness, countless small sea creatures – from squid to krill – swim from the ocean depths to near the surface to feed. This vast animal migration – the largest on the planet and a critical part of Earth’s climate system – has been observed globally for the first time thanks to an unexpected use of a space-based laser.

Researchers observed this vertical migration pattern using the Cloud-Aerosol Lidar and Infrared Pathfinder Satellite Observations (CALIPSO) satellite — a joint venture between NASA and the French space agency, Centre National d’Etudes Spatiales — that launched in 2006. They published their findings in the journal Nature Wednesday.

“This is the latest study to demonstrate something that came as a surprise to many: that lidars have the sensitivity to provide scientifically useful ocean measurements from space,” said Chris Hostetler, a scientist at NASA’s Langley Research Center in Hampton, Virginia, and co-author on the study. “I think we are just scratching the surface of exciting new ocean science that can be accomplished with lidar.”

The study looks at a phenomenon known as Diel Vertical Migration (DVM), in which small sea creatures swim up from the deep ocean at night to feed on phytoplankton near the surface, then return to the depths just before sunrise. Scientists recognize this natural daily movement around the world as the largest migration of animals on Earth in terms of total number.

The cumulative effect of daily vertically migrating creatures on Earth’s climate is significant. During the day, ocean phytoplankton photosynthesize and, in the process, absorb significant amounts of carbon dioxide, which contributes to the ocean’s ability to absorb the greenhouse gas from the atmosphere. Animals that undergo DVM come up to the surface to feed on phytoplankton near the ocean’s surface and then swim back down, taking the phytoplankton carbon with them. Much of this carbon is then defecated at depths where it is effectively trapped deep in the ocean, preventing its release back into the atmosphere.

“What the lidar from space allowed us to do is sample these migrating animals on a global scale every 16 days for 10 years,” said Mike Behrenfeld, the lead for the study and a senior research scientist and professor at Oregon State University in Corvallis, Oregon. “We’ve never had anywhere near that kind of global coverage to allow us to look at the behavior, distribution and abundance of these animals.”

Zeroing in on tropical and subtropical ocean regions, researchers found that while there are fewer vertically migrating animals in lower-nutrient and clearer waters, they comprise a greater fraction of the total animal population in these regions. This is because the migration is a behavior that has evolved primarily to avoid visual predators during the day when visual predators have their greatest advantage in clear ocean regions.

In murkier and more nutrient-rich regions, the abundance of animals that undergo DMV is higher, but they represent a smaller fraction of the total animal population because visual predators are at a disadvantage. In these regions, many animals just stay near the surface both day and night.

The researchers also observed long-term changes in populations of migrating animals, likely driven by climate variations. During the study period (2008 to 2017), CALIPSO data revealed an increase in migrating animal biomass in the subtropical waters of the North and South Pacific, North Atlantic and South Indian oceans. In the tropical regions and North Atlantic, biomass decreased. In all but the tropical Atlantic regions, these changes correlated with changes in phytoplankton production.

This animal-mediated carbon conveyor belt is recognized as an important mechanism in Earth’s carbon cycle. Scientists are adding animals that undergo DVM as a key element in climate models.

“What these modelers haven’t had is a global dataset to calibrate these models with, to tell them where these migrators are most important, where they’re most abundant, and how they change over time,” said Behrenfeld. “The new satellite data give us an opportunity to combine satellite observations with the models and do a better job quantifying the impact of this enormous animal migration on Earth’s carbon cycle.”

The satellite data are also relevant to global fisheries because the migrating animals are an important food source for larger predators that lurk in the depths of the ocean. Those predators are often species of fish that are attractive to commercial fisheries. The larger the DVM signal, the larger the population of fish that can live in the deep sea.

Though CALIPSO’s laser was designed to measure clouds and atmospheric aerosols, it can penetrate the upper 20 meters of the ocean’s surface layer. If the migrating animals reach this layer, they are detected by CALIPSO.

NASA uses the vantage point of space to understand and explore our home planet, improve lives and safeguard our future. The agency’s observations of Earth’s complex natural environment are critical to understanding how our planet’s natural resources and climate are changing now and could change in the future.

For more information about NASA’s Earth science activities, visit:

-end-

Steve Cole
Headquarters, Washington
202-358-0918
stephen.e.cole@nasa.gov

Joe Atkinson
Langley Research Center, Hampton, Va.
757-864-5644
joseph.s.atkinson@nasa.gov

Continue Reading

Drought-Stressed Forest Fueled Amazon Fires

NASA's ECOSTRESS sensor measured the stress levels of plants when it passed over the Peruvian Amazon rainforest on Aug. 7, 2019. The map reveals that the fires were concentrated in areas of water-stressed plants (brown). The pattern points to how plant health can impact the spread of fires. Credits: NASA/JPL-Caltech/Earth Observatory

NASA’s ECOSTRESS sensor measured the stress levels of plants when it passed over the Peruvian Amazon rainforest on Aug. 7, 2019. The map reveals that the fires were concentrated in areas of water-stressed plants (brown). The pattern points to how plant health can impact the spread of fires.
Credits: NASA/JPL-Caltech/Earth Observatory

A new satellite-based map of a section of the Amazon Basin reveals that at least some of the massive fires burning there this past summer were concentrated in water-stressed areas of the rainforest. The stressed plants released measurably less water vapor into the air than unstressed plants; in other words, they were struggling to stay cool and conserve water, leaving them more vulnerable to the fires.

The fires in the Amazon Basin, which continue to burn into November, are mainly the result of such human activities as land clearing and deforestation. The pattern — spotted from space by NASA’s ECOsystem Spaceborne Thermal Radiometer Experiment on Space Station (ECOSTRESS) — points to how water-stressed plants can impact the spread of fires. The data may one day help NASA’s Earth-observing missions predict the path of future forest or brush fires like those currently raging in California.

The primary mission of ECOSTRESS, an instrument that measures thermal infrared energy emitted from the land surface, is to provide insight into plants’ health by taking their temperature. To keep cool, plants “sweat” by releasing water vapor through their pores, a process called evapotranspiration. After multiple orbits, ECOSTRESS is able to measure how much plants transpire and track their response to climate change.

In August, fires spread over large swaths of the Amazon Basin. ECOSTRESS captured the first image of the Amazon rainforest in Peru before the fires began, on Aug. 7. It shows a surface temperature map revealing water-stressed and non-stressed forest (shown in brown and blue, respectively). The fire icons represent fires imaged by NASA’s Terra satellite between Aug. 19 and 26. The fires are limited primarily to areas of water-stressed plants that transpired the least. The second image, taken by the Terra satellite on Aug. 18, shows the ECOSTRESS study area and smoke from active fires in the rainforest.

This satellite image, taken by NASA's Earth-observing Terra satellite on Aug. 18, 2019, shows the ECOSTRESS study area in the Amazon Basin and smoke from active fires in the rainforest. Credits: NASA/JPL-Caltech/Earth Observatory

This satellite image, taken by NASA’s Earth-observing Terra satellite on Aug. 18, 2019, shows the ECOSTRESS study area in the Amazon Basin and smoke from active fires in the rainforest.
Credits: NASA/JPL-Caltech/Earth Observatory

The image also reveals how certain parts of the forest were more resilient, seeming to protect themselves from burning. Plants in these areas were cooler — in other words, they released more water vapor from their leaves — than plants in the burn zones, though mission scientists don’t know whether that’s a coincidence or a direct causal relationship. The water-stressed areas of the forest look as green and healthy as these cooler areas, making them invisible except to a radiometer that can measure thermal infrared energy from the surface.

“To the naked eye, the fires appear randomly distributed throughout the forest,” said Josh Fisher, ECOSTRESS science lead at NASA’s Jet Propulsion Laboratory in Pasadena, California. “But, if you overlay the ECOSTRESS data, you can see that the fires are mainly confined within the highly water-stressed areas. The fires avoided the low-stress areas where the forest appears to have access to more water.”

It’s still a mystery why some plants become stressed while other plants don’t, though scientists believe it’s dependent on factors like the species of plant or amount of water in the soil. The data from ECOSTRESS will help answer questions about which plants will thrive in their changing environments and could also be used to help with decisions related to water management and agricultural irrigation.

JPL built and manages the ECOSTRESS mission for the Earth Science Division in the Science Mission Directorate at NASA Headquarters in Washington. ECOSTRESS is an Earth Venture Instrument mission; this program is managed by NASA’s Earth System Science Pathfinder program at NASA’s Langley Research Center in Hampton, Virginia.

More information about ECOSTRESS is available here:

Arielle Samuelson
Jet Propulsion Laboratory, Pasadena, Calif.
818-354-0307
arielle.a.samuelson@jpl.nasa.gov

2019-221

Continue Reading

Powered by WordPress. Designed by WooThemes