CloudSat
https://cloudsat.atmos.colostate.edu/home
https://cloudsat.atmos.colostate.edu/data
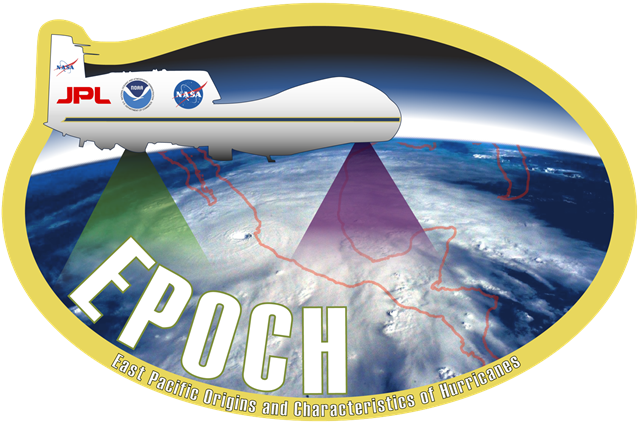
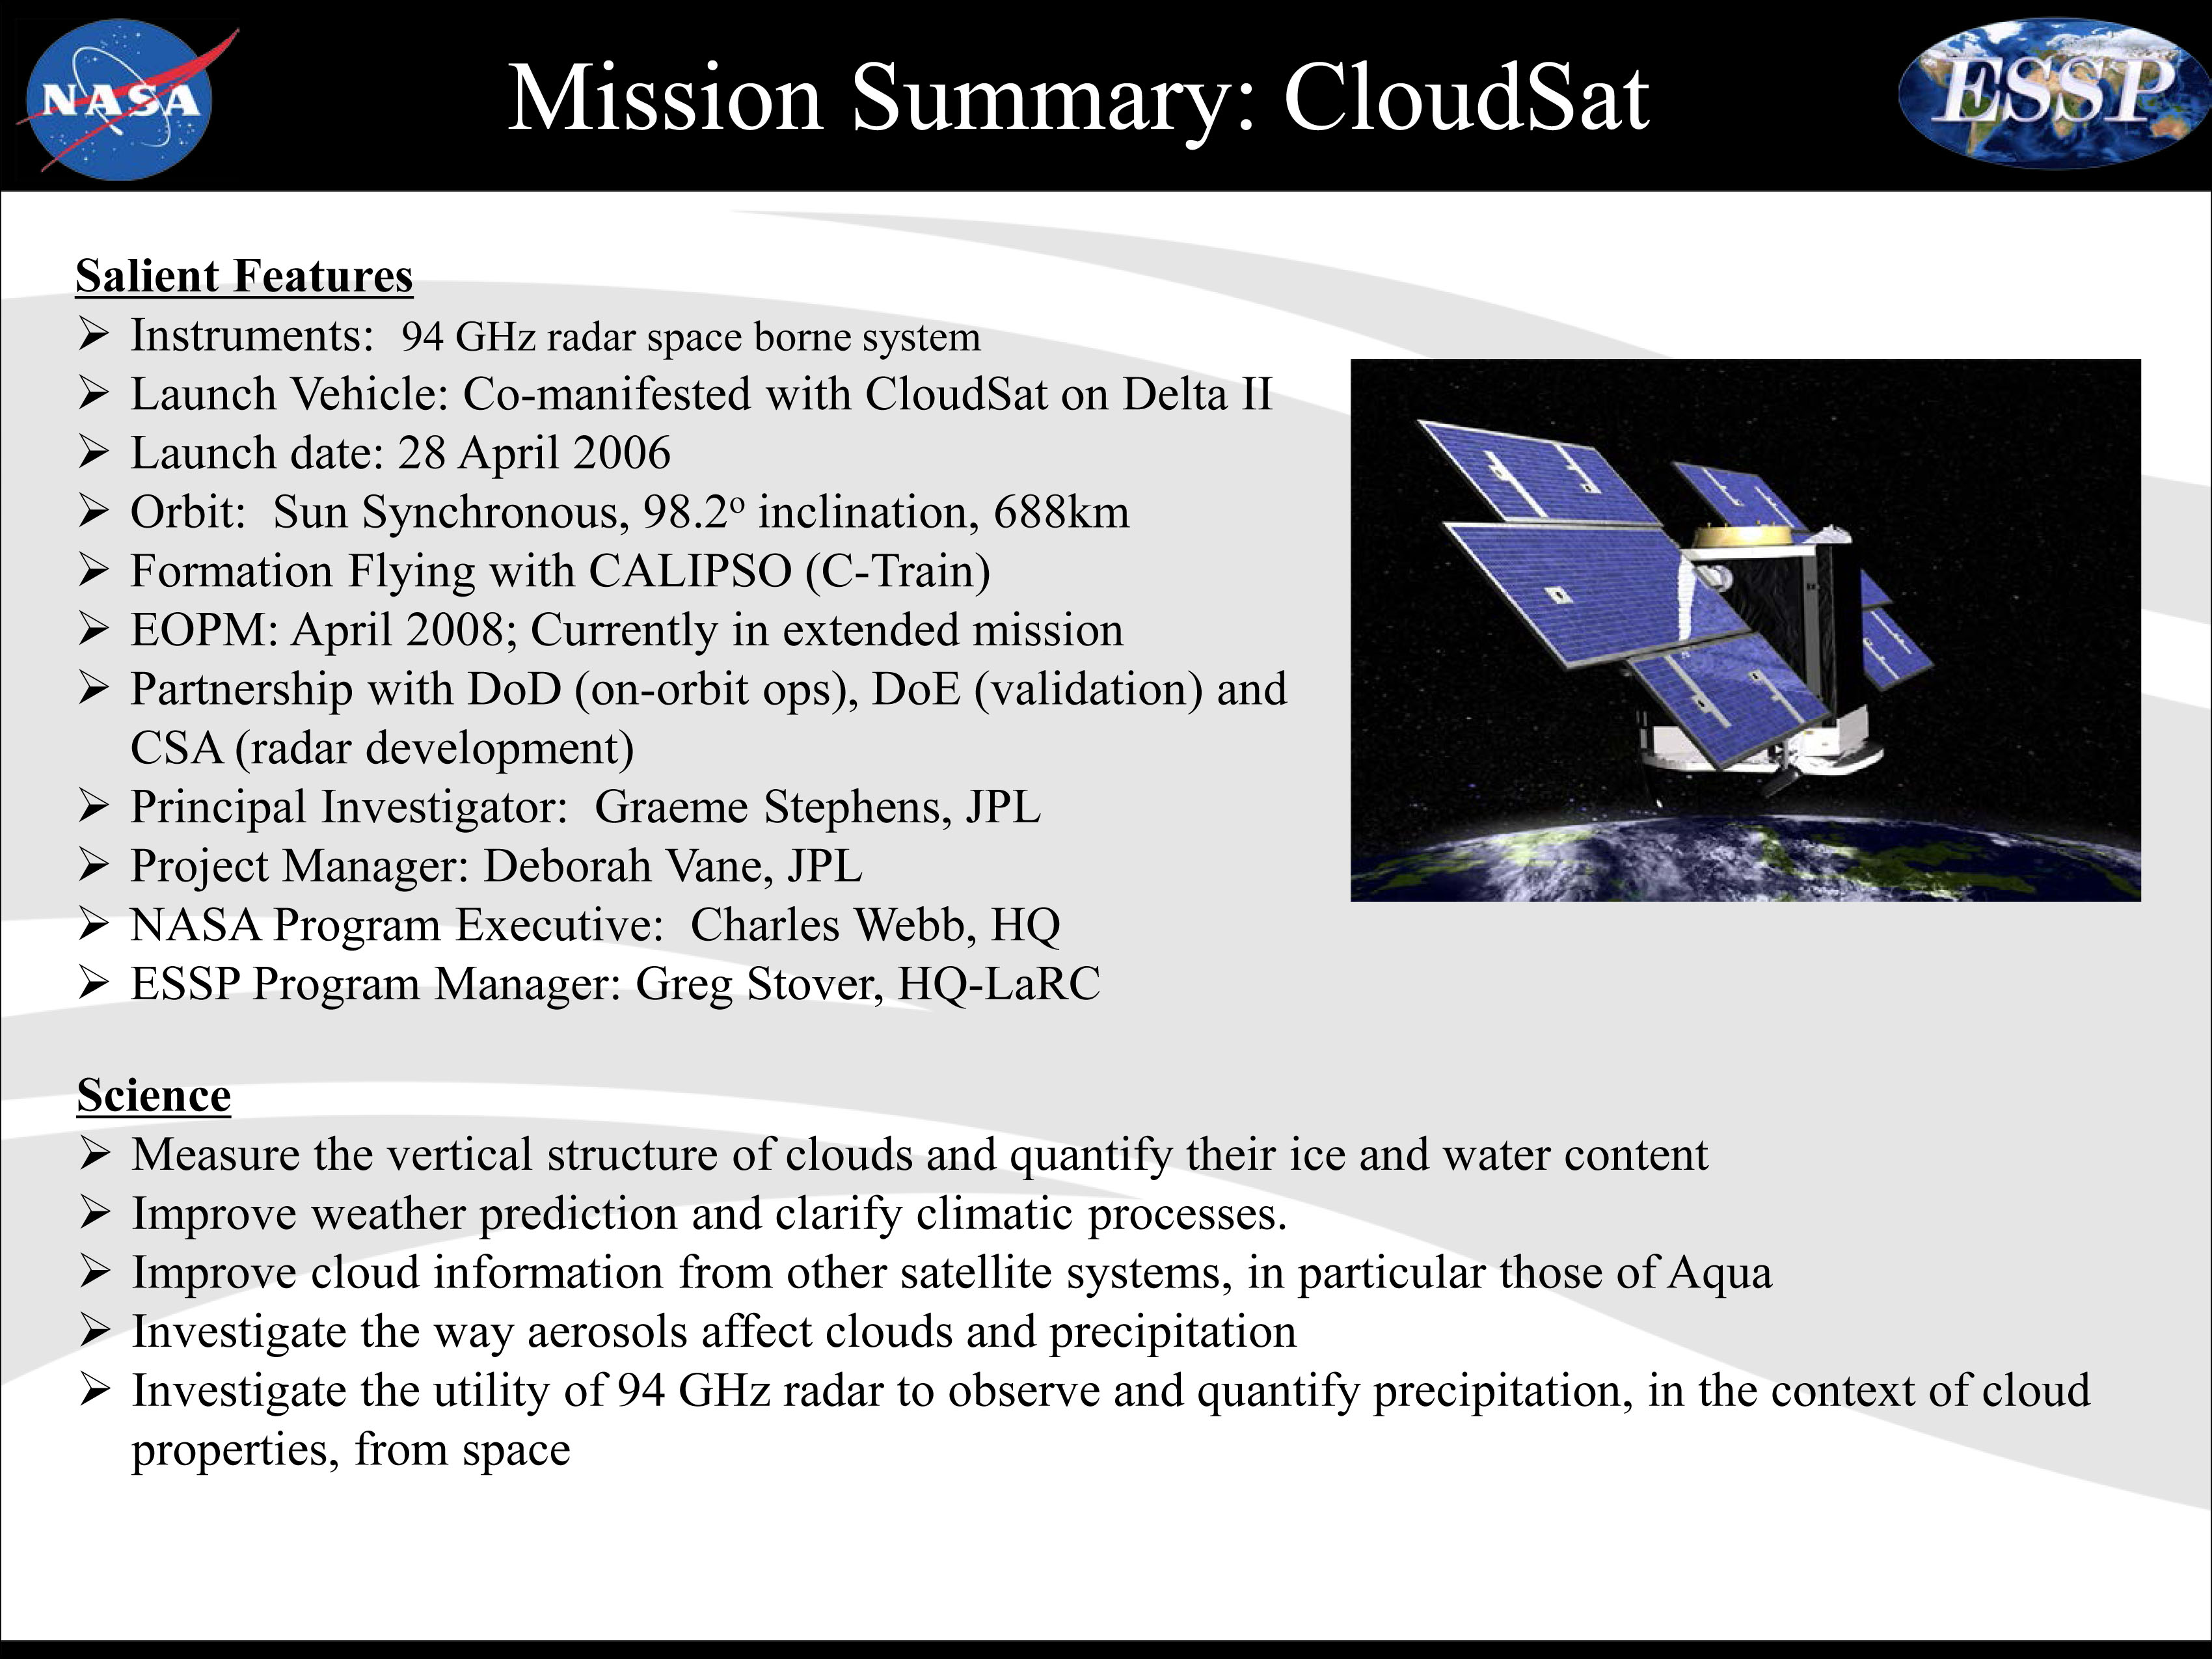
CloudSat is one of NASA’s weather and climate-tracking satellites, and from its name, it’s apparent what it measures – clouds!! Clouds have an enormous influence on Earth’s weather, climate and energy balance, and CloudSat has been helping scientists learn about clouds since it was launched on a Delta II rocket in 2006. From providing a view from space as we watch an approaching hurricane to providing details about how clouds impact radiation from the sun and the climate, CloudSat has been understanding the impact of clouds for nearly 15 years.
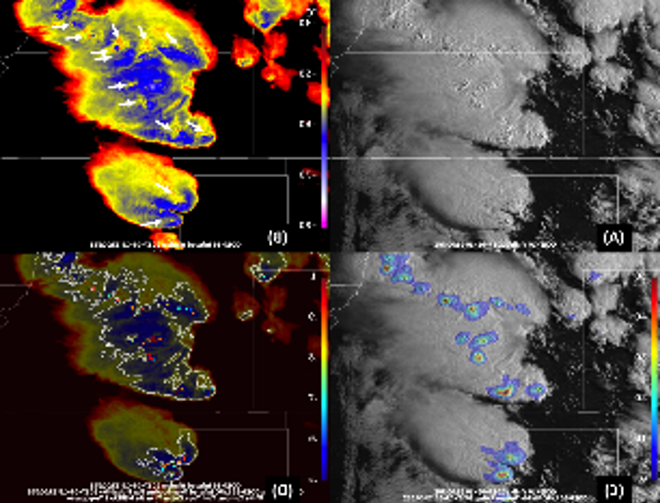
The cloud radar on CloudSat is 1000 times more sensitive than most weather radars on the ground. With its long history sending us data about clouds, CloudSat has contributed so much valuable information! CloudSat provides a never-before-seen perspective on clouds; its radar allows us to see inside the large cloud masses that make our weather. This helps us understand processes such as those that convert the tiny cloud particles to precipitation. Key discoveries from CloudSat have included how often the clouds above Earth rain and snow, how much ice and water are in clouds, and how clouds heat or cool the atmosphere. Cloudsat measurements have shown how pollution, volcanic ash, and other aerosols can interact with clouds and affect both precipitation and how efficiently clouds reflect sunlight, which has a huge impact on climate. The cloud and precipitation measurements from CloudSat have been used to track the intensity and patterns of tropical cyclones as they become hurricanes. All of these critical observations will ultimately help us predict the effects of clouds on our climate and improve our predictions of climate change.


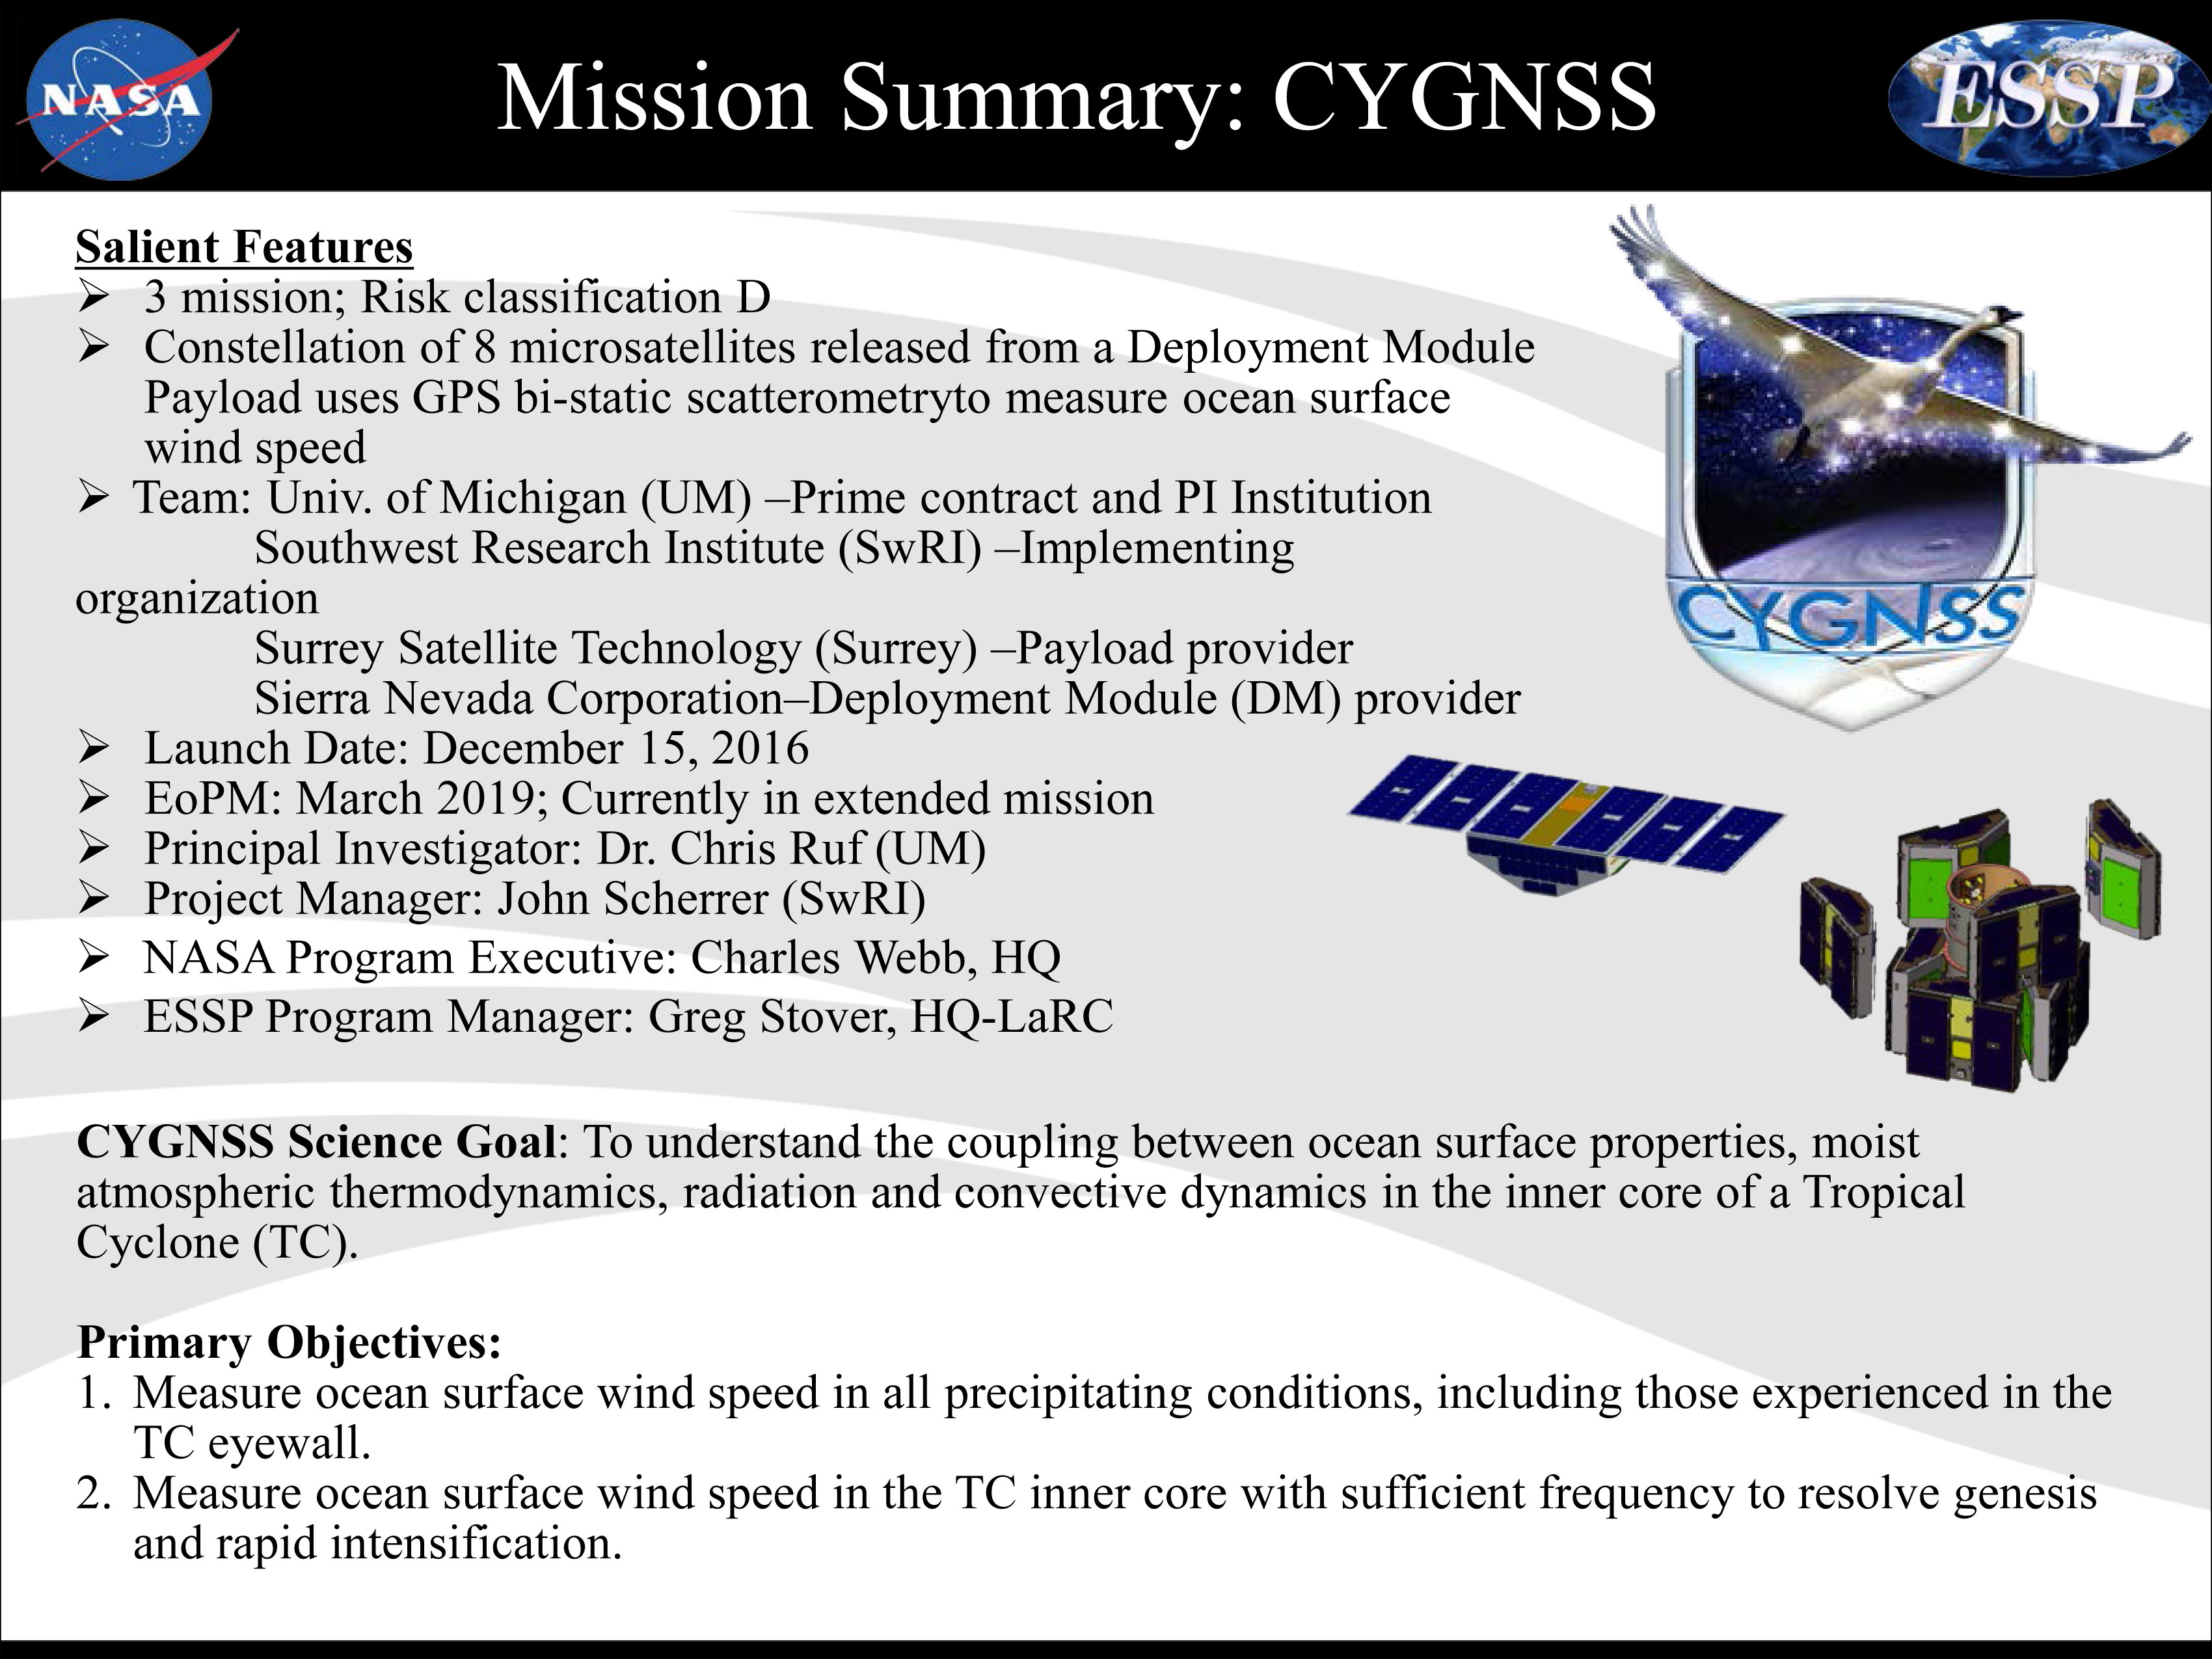
 Cyclone Global Navigation Satellite System (CYGNSS)