Author Archive | achipman
NASA’s ECOSTRESS Sees Las Vegas Streets Turn Up the Heat
NASA to Launch 6 Small Satellites to Monitor, Study Tropical Cyclones
5 Things to Know About NASA’s New Mineral Dust Detector
NASA’s ECOSTRESS Detects ‘Heat Islands’ in Extreme Indian Heat Wave
Storm Chasing Scientists Fly Into the Clouds to Understand Winter Snowstorms
NASA’s storm-chasing planes fly through blizzards to improve snowfall forecasts
‘Rocked’: NASA scientists brave bumpy flights into winter storms
A BIOS Treasure: The Tudor Hill Marine Atmospheric Observatory
by: Bermuda Institute of Ocean Sciences
TEMPO Air Pollution Sensor Integrated with Satellite Host
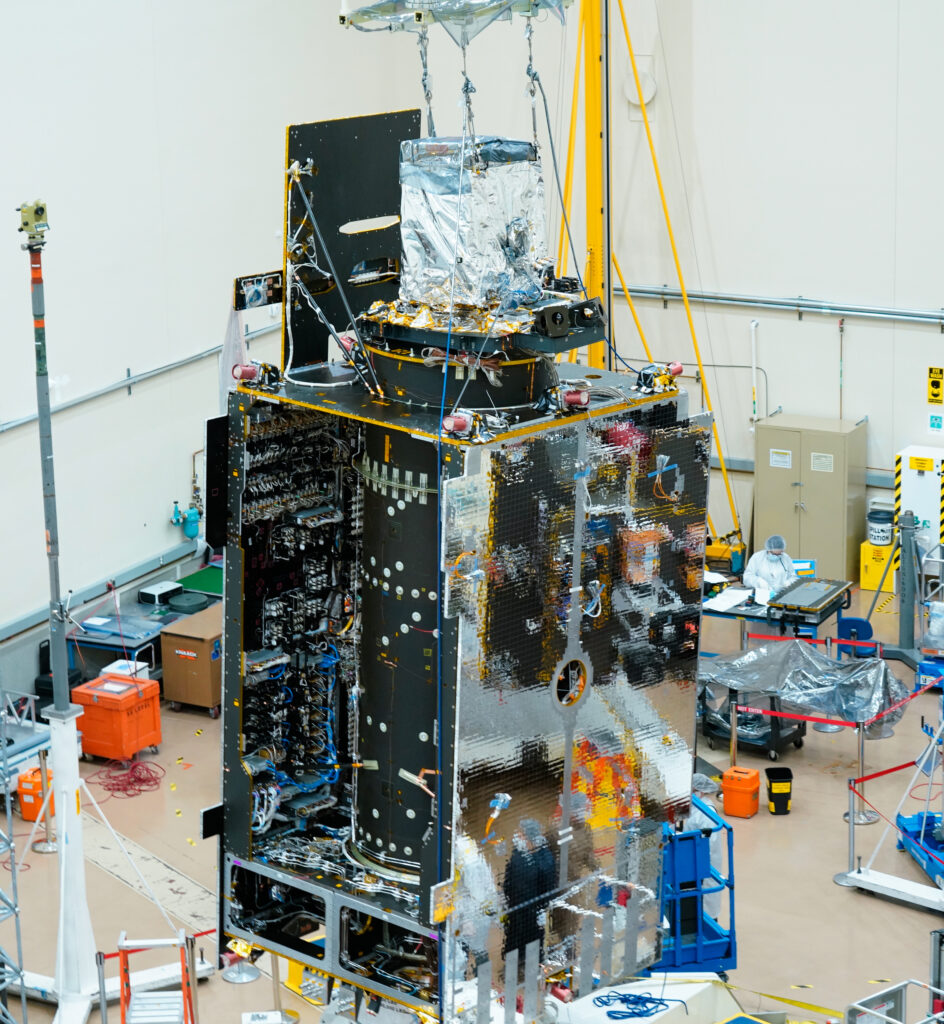
Credits: Image courtesy of Maxar
An air quality sensor that will dramatically improve the way scientists measure air pollution over North America has been joined with its satellite host.
NASA’s Tropospheric Emissions: Monitoring of Pollution (TEMPO) instrument was integrated with Intelsat 40e by Maxar’s Space Program Delivery team in Palo Alto, California. From its geostationary orbit — a high Earth orbit that allows satellites to match Earth’s rotation — TEMPO will take hourly daytime observations of air quality over an area that extends from Puerto Rico to northern Canada, from the Atlantic to the Pacific, encompassing the entire continental United States.
“Because of the hard work and dedication of the entire TEMPO team including our Maxar, Intelsat, and Ball Aerospace partners, we are excited to have completed this significant step toward launching with the IS40e spacecraft ” said Kevin Daugherty, TEMPO project manager at NASA’s Langley Research Center in Hampton, Virginia. “We are looking forward to completing the instrument integration and spacecraft testing in the coming months bringing us closer to delivery of TEMPO’s critical air quality science.”
Air pollution — including ozone, nitrogen dioxide and formaldehyde, and tiny atmospheric particles called aerosols — can have serious consequences for human health and the environment.
Currently scheduled to launch in 2022, TEMPO will also form part of an air quality satellite “virtual constellation” that will offer a more holistic view of how pollution is transported around the Northern Hemisphere. Ball Aerospace in Broomfield, Colorado built the TEMPO instrument.
Kelly Chance, of the Smithsonian Astrophysical Observatory in Cambridge, Massachusetts, is the principal investigator for TEMPO.
NASA Langley Research Center Last Updated: Dec 1, 2021 Editor: Joe Atkinson
https://www.nasa.gov/feature/langley/tempo-air-pollution-sensor-integrated-with-satellite-host